Seven (yes, 7!) New Google Data Studio Connectors Released
Dragon Metrics customers are never short on fantastic options for delivering reports to clients and stakeholders. Whether it’s using the Report Builder to create automated, beautiful, and extremely customizable white-labeled reports, setting up scheduled exports to be sent directly to your inbox or FTP server, leveraging the Dragon Metrics developer API, or using our Google Data Studio connectors, there’s a perfect solution for just about every need.
Today, we’re taking reporting even further with the launch of 7 new Google Data Studio connectors that help you visualize your data in every way possible.
Since showing is often better than telling, I know many of you will want to see a sample report to quickly see a glimpse of what’s possible in the reports. When you’re done, we can continue onward.
The feedback from the first round of Google Data Studio connectors was very positive, but our customers wanted more — so that’s what we’re delivering with this new update.
Let’s take a look at just what these new connectors can do!
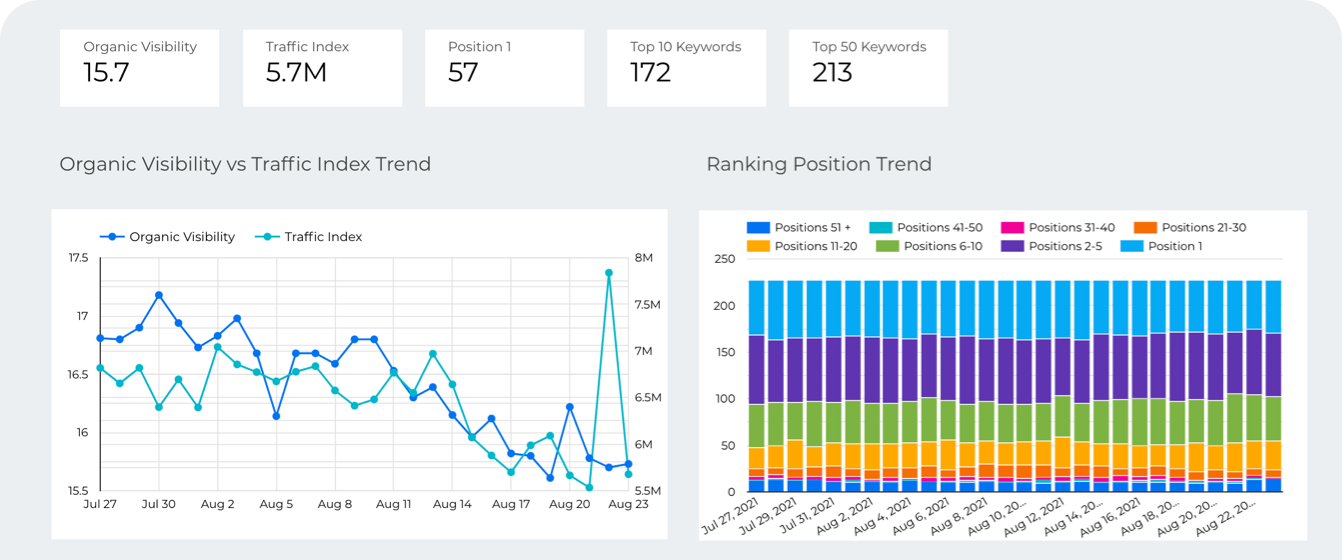
A trend of aggregate ranking data (such as Organic Visibility, Traffic Index, and position distribution) for a single site over the selected date range.
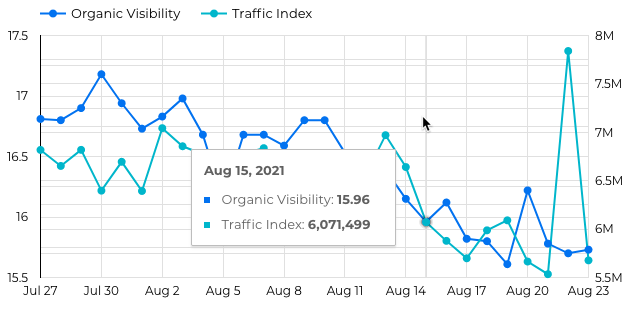
Organic Visibility vs Traffic Index Trend — Line chart with Dimension set to Date, and Organic Visibility and Traffic Index as Metrics.
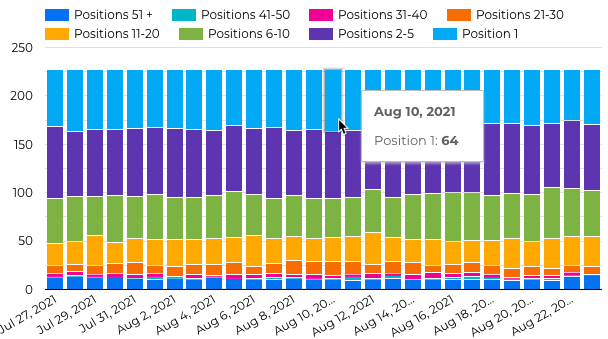
Ranking Position Distribution Trend — Stacked column chart with Dimension set to Date and all of the position groups (e.g. Position 1, Position 2-5, etc.) set as Metrics.
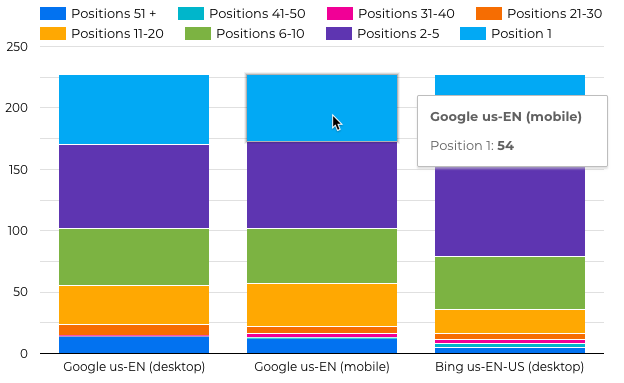
Ranking Position Distribution by Search Engine — Stacked column chart with Dimension set to Search Engine and all of the position groups (e.g. Position 1, Position 2-5, etc.) set as Metrics. Set the date range to a single date.
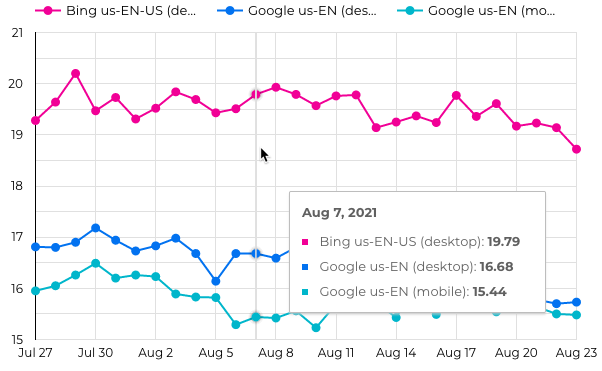
Organic Visibility Trend by Search Engine — Line chart with Dimension set to Date, Breakdown Dimension set to Search Engine, and Organic Visibility as Metric.
A trend of Competitor Discovery data (automatically tracks the performance of the 50 highest ranking sites for a set of tracked keywords per search engine, tag, and campaign) over the selected date range.
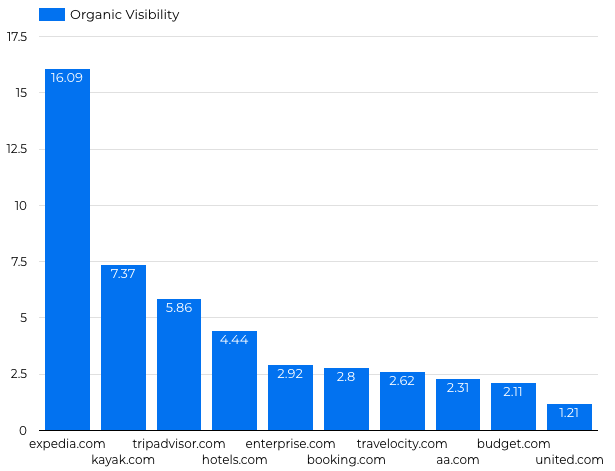
Top Ranking Competitors — Choose Bar chart, set Dimension to Site, and Organic Visibility as the Metric. You’ll also want to set the date to a single date.
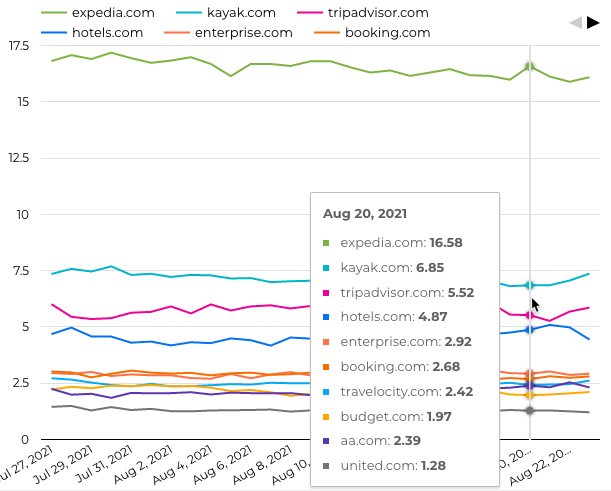
Trend of Top Ranking Competitors — Choose Line chart, set Dimension to Date, Breakdown Dimension to Site and Organic Visibility as the Metric.
Compare ranking performance of tags over the selected date range.
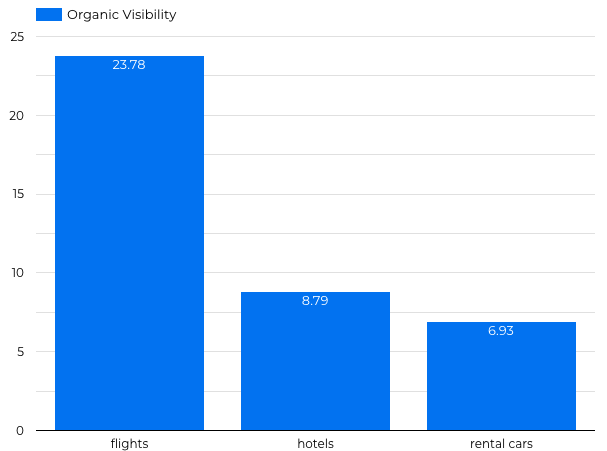
Organic Visibility by Tag — Choose Bar chart, set Dimension to Tag, and Organic Visibility as the Metric. Choose only a single date.
Organic Visibility Trends by Tag — Choose Line chart, set Dimension to Date, Breakdown Dimension to Tag and Organic Visibility as the Metric.
The most simple connector in the bunch, the Keywords connector shows keyword-level ranking data comparing the ranking position between 2 dates.
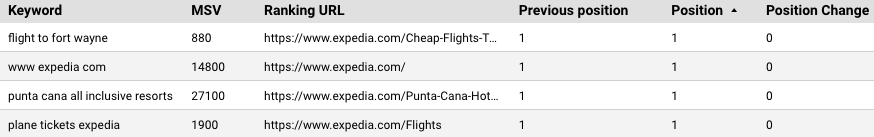
Basic keyword ranking with landing pages — a simple, classic report
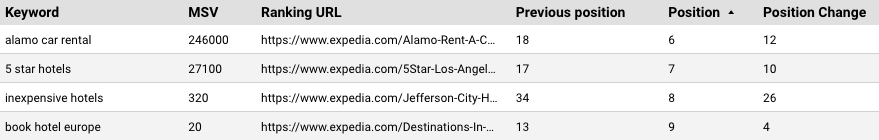
Highest ranking keywords — Sort by Position ascending to see your best performing terms
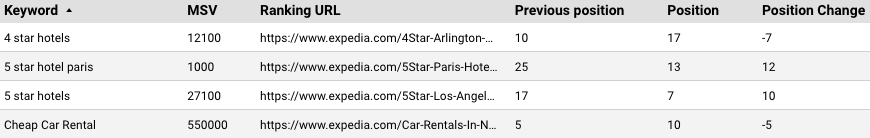
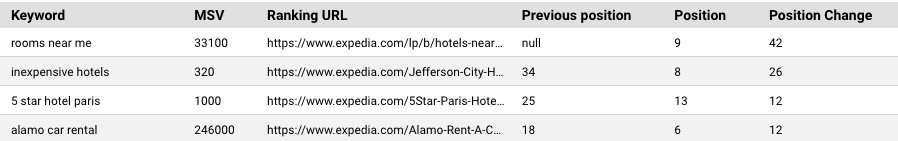
Biggest improving keywords — Sort by Position Change descending to see keywords that are moving up
Biggest dropping keywords — Sort by Position Change ascending to see keywords that have dropped the most
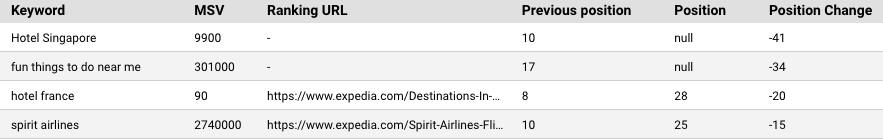
Keywords new to page 1 — Add a filter to include Position <=10 AND Previous Position >10.
(Flip it around to Previous Position <=10 AND Position >10 to see keywords that left page 1, or change 10 to any value to see keywords new/left any position group.)
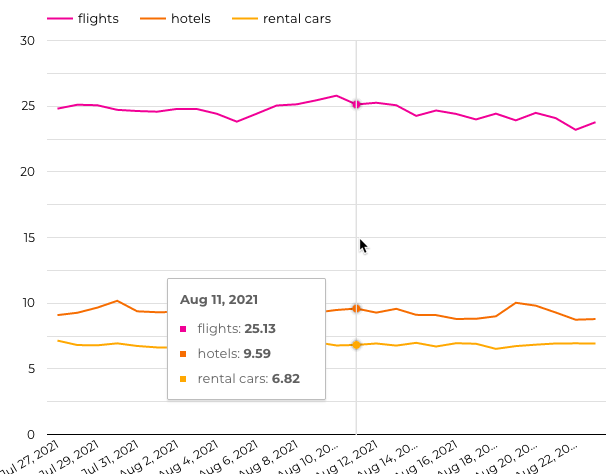
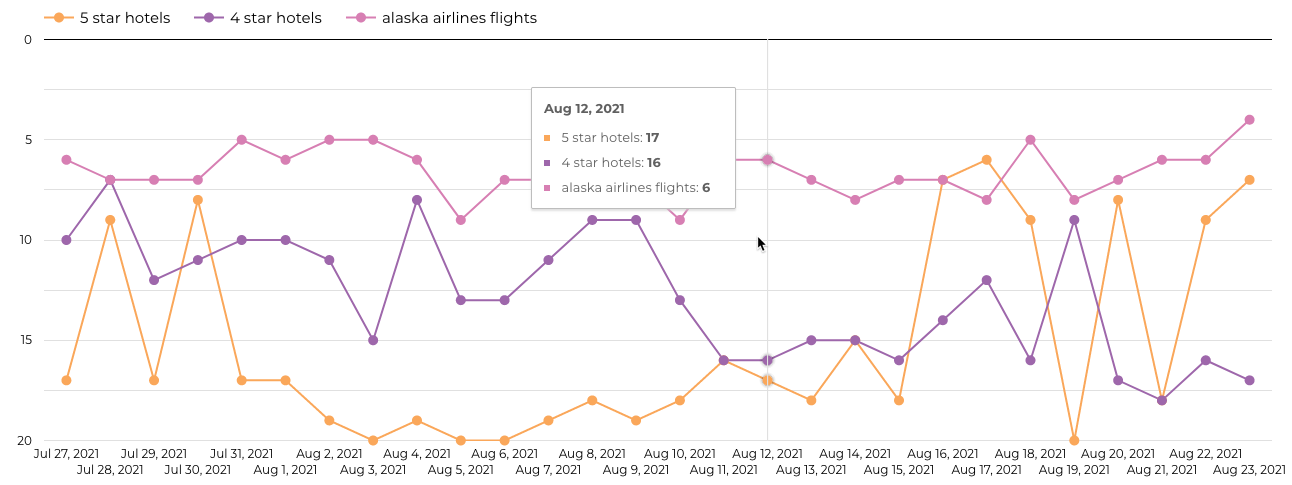
Very similar to Keywords 2.0, but includes ranking data for all dates in the selected range instead of just the first and last dates.
Compare keyword trends for most important keywords — Select line chart with dimension set to Date, Breakdown dimension as Keyword, and Position for Metric.
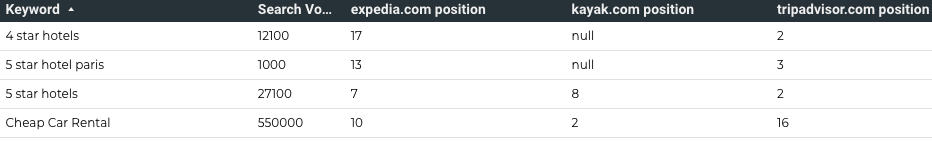
Compare ranking positions of individual keywords between a set of competitor sites for a single date (the end date of the selected range).
Keyword ranking comparison by site — Choose Keyword and each competitor sites' Position field as Dimensions.
A trend of high-level ranking data of tracked competitors over the selected date range.
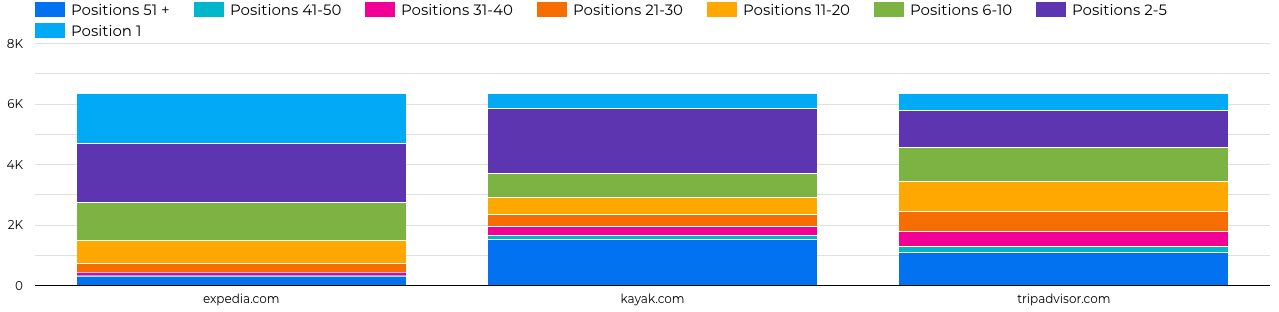
Ranking position distribution by competitor site — Stacked column chart with Dimension set to Site and all of the position groups (e.g. Position 1, Position 2-5, etc.) set as Metrics. Choose only a single date.
All of these connectors are available right now, so go try them out! Get the links to each connector and read the full documentation in our Knowledge Base (must be logged into your Dragon Metrics account to view).