All the Data at Your Fingertips – New Dashboard Released
It’s been a big week here at Dragon Metrics. Not only have we released an amazing new way to do white-labeled reporting, we’ve totally revamped the dashboard, too!
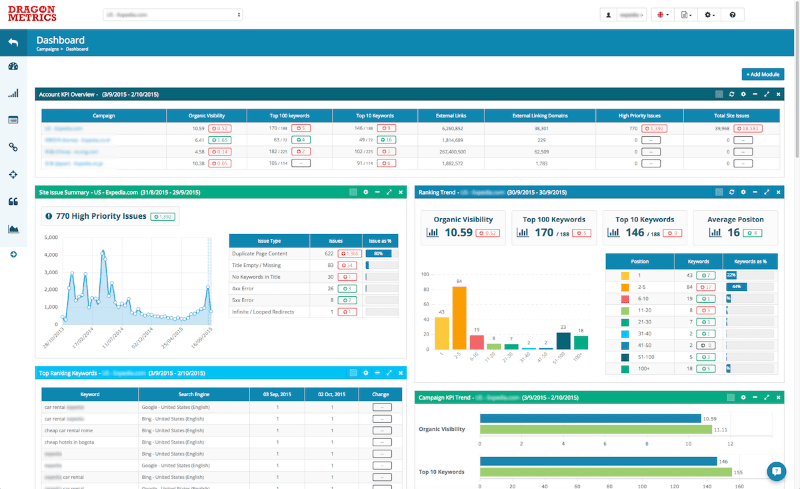
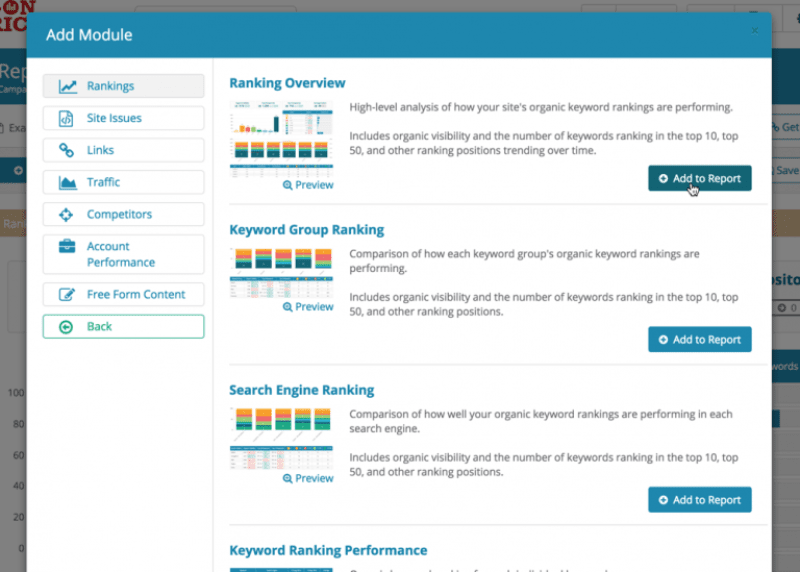
Using the same 48 new reporting modules as the Custom Report Builder, just about every data point, chart, and metric tracked by Dragon Metrics is at your fingertips. All your high-level reports are available instantly in one glace, as soon as you log in.
The same basic interface is the same as before — you can drag, drop, and customize modules as you see fit. But with the addition of 48 new reports, you now have even more freedom to customize your dashboard exactly the way you want it.
In order to better show the new reports, many users will now see a one-column layout on the dashboard. However, larger displays will show a two-column display, allowing for a truly massive amount of data on one screen.

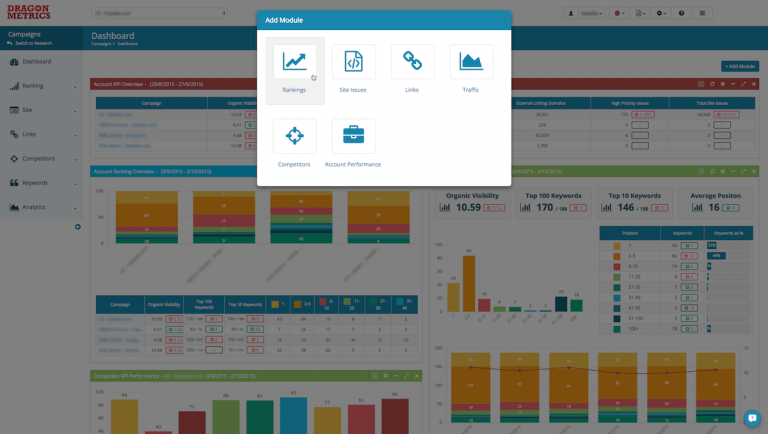
If you’ve already logged into Dragon Metrics this week, you’ve already seen the new dashbaord in action. All of your previous dashboard modules have been transitioned over to its redesigned new version. But we highly recommend exploring all of the new modules and options offered. Just click the “+ Add Module” button in the upper right of the page, or the settings icon on each module to start customizing!
As always, we’re eager to hear what you think. Let us know your feedback using the chat widget in the bottom right of every page.