Core Web Vitals Performance Tracking Now in Dragon Metrics
Site speed is one of the most challenging aspects of SEO, user experience, and web development. Part of this challenge of course is finding the right tool. Thankfully, Dragon Metrics is here to make things a lot easier.
Today we’re launching a suite of tools that help measure page speed and Core Web Vitals performance across your site.
These tools bring together the best of all worlds:
While these reports are technically in beta, we’re too excited to keep them under wraps any longer. Read on for details of everything in today’s release — we think you’ll be excited too.
Determining a page’s speed can be tricky business. On one hand, most people “know it when they see it”, but how do you quantify this with real data? With so many different ways of measuring performance, site owners have struggled to figure out which metric they should optimize for.
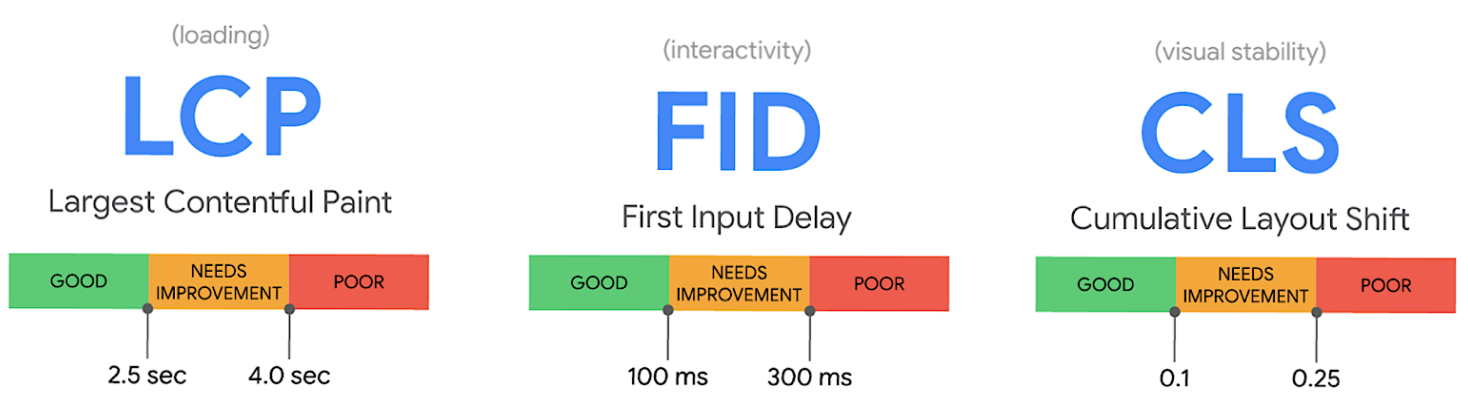
Knowing this, Google has defined 3 metrics that measure different aspects of a page’s performance, dubbed Core Web Vitals. Generally speaking if a page performs well for these 3 metrics, real-world users will have a fast-loading and positive user experience as well.
In August 2021, Google concluded their rollout of the Page Experience algorithm update, which included Core Web Vitals performance on mobile devices as a ranking signal. In February 2022, desktop performance will be included as a ranking signal as well.
Dragon Metrics' new Core Web Vitals tracking arrives just in time to help monitor performance before this new update takes effect.
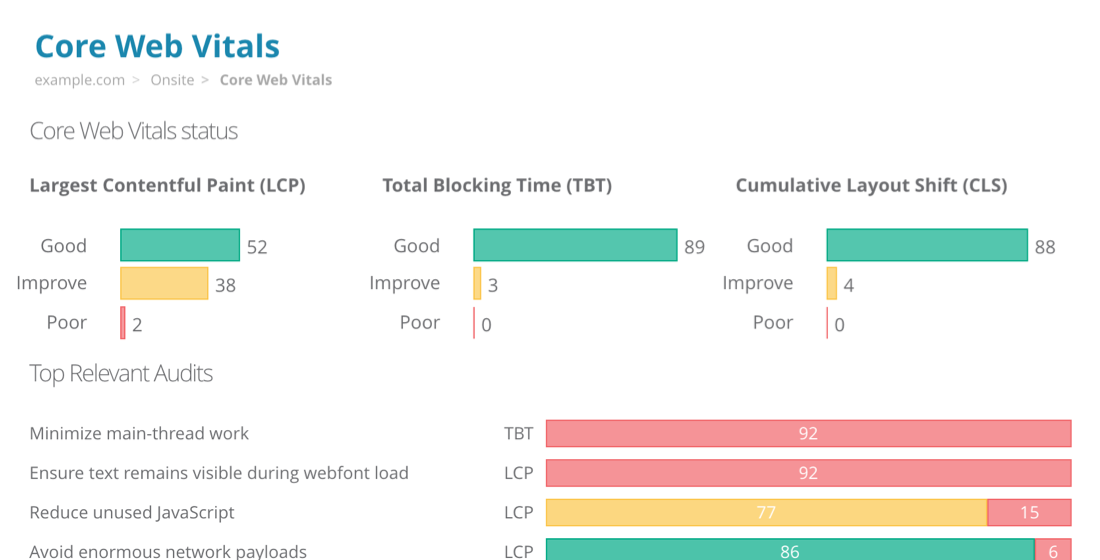
The best place to get started analyzing your site’s performance is the Core Web Vitals report. This report provides an overview of how your site is doing over time, how your site is performing on each Core Web Vital, the most common issues found, and links to detailed reports for each URL.
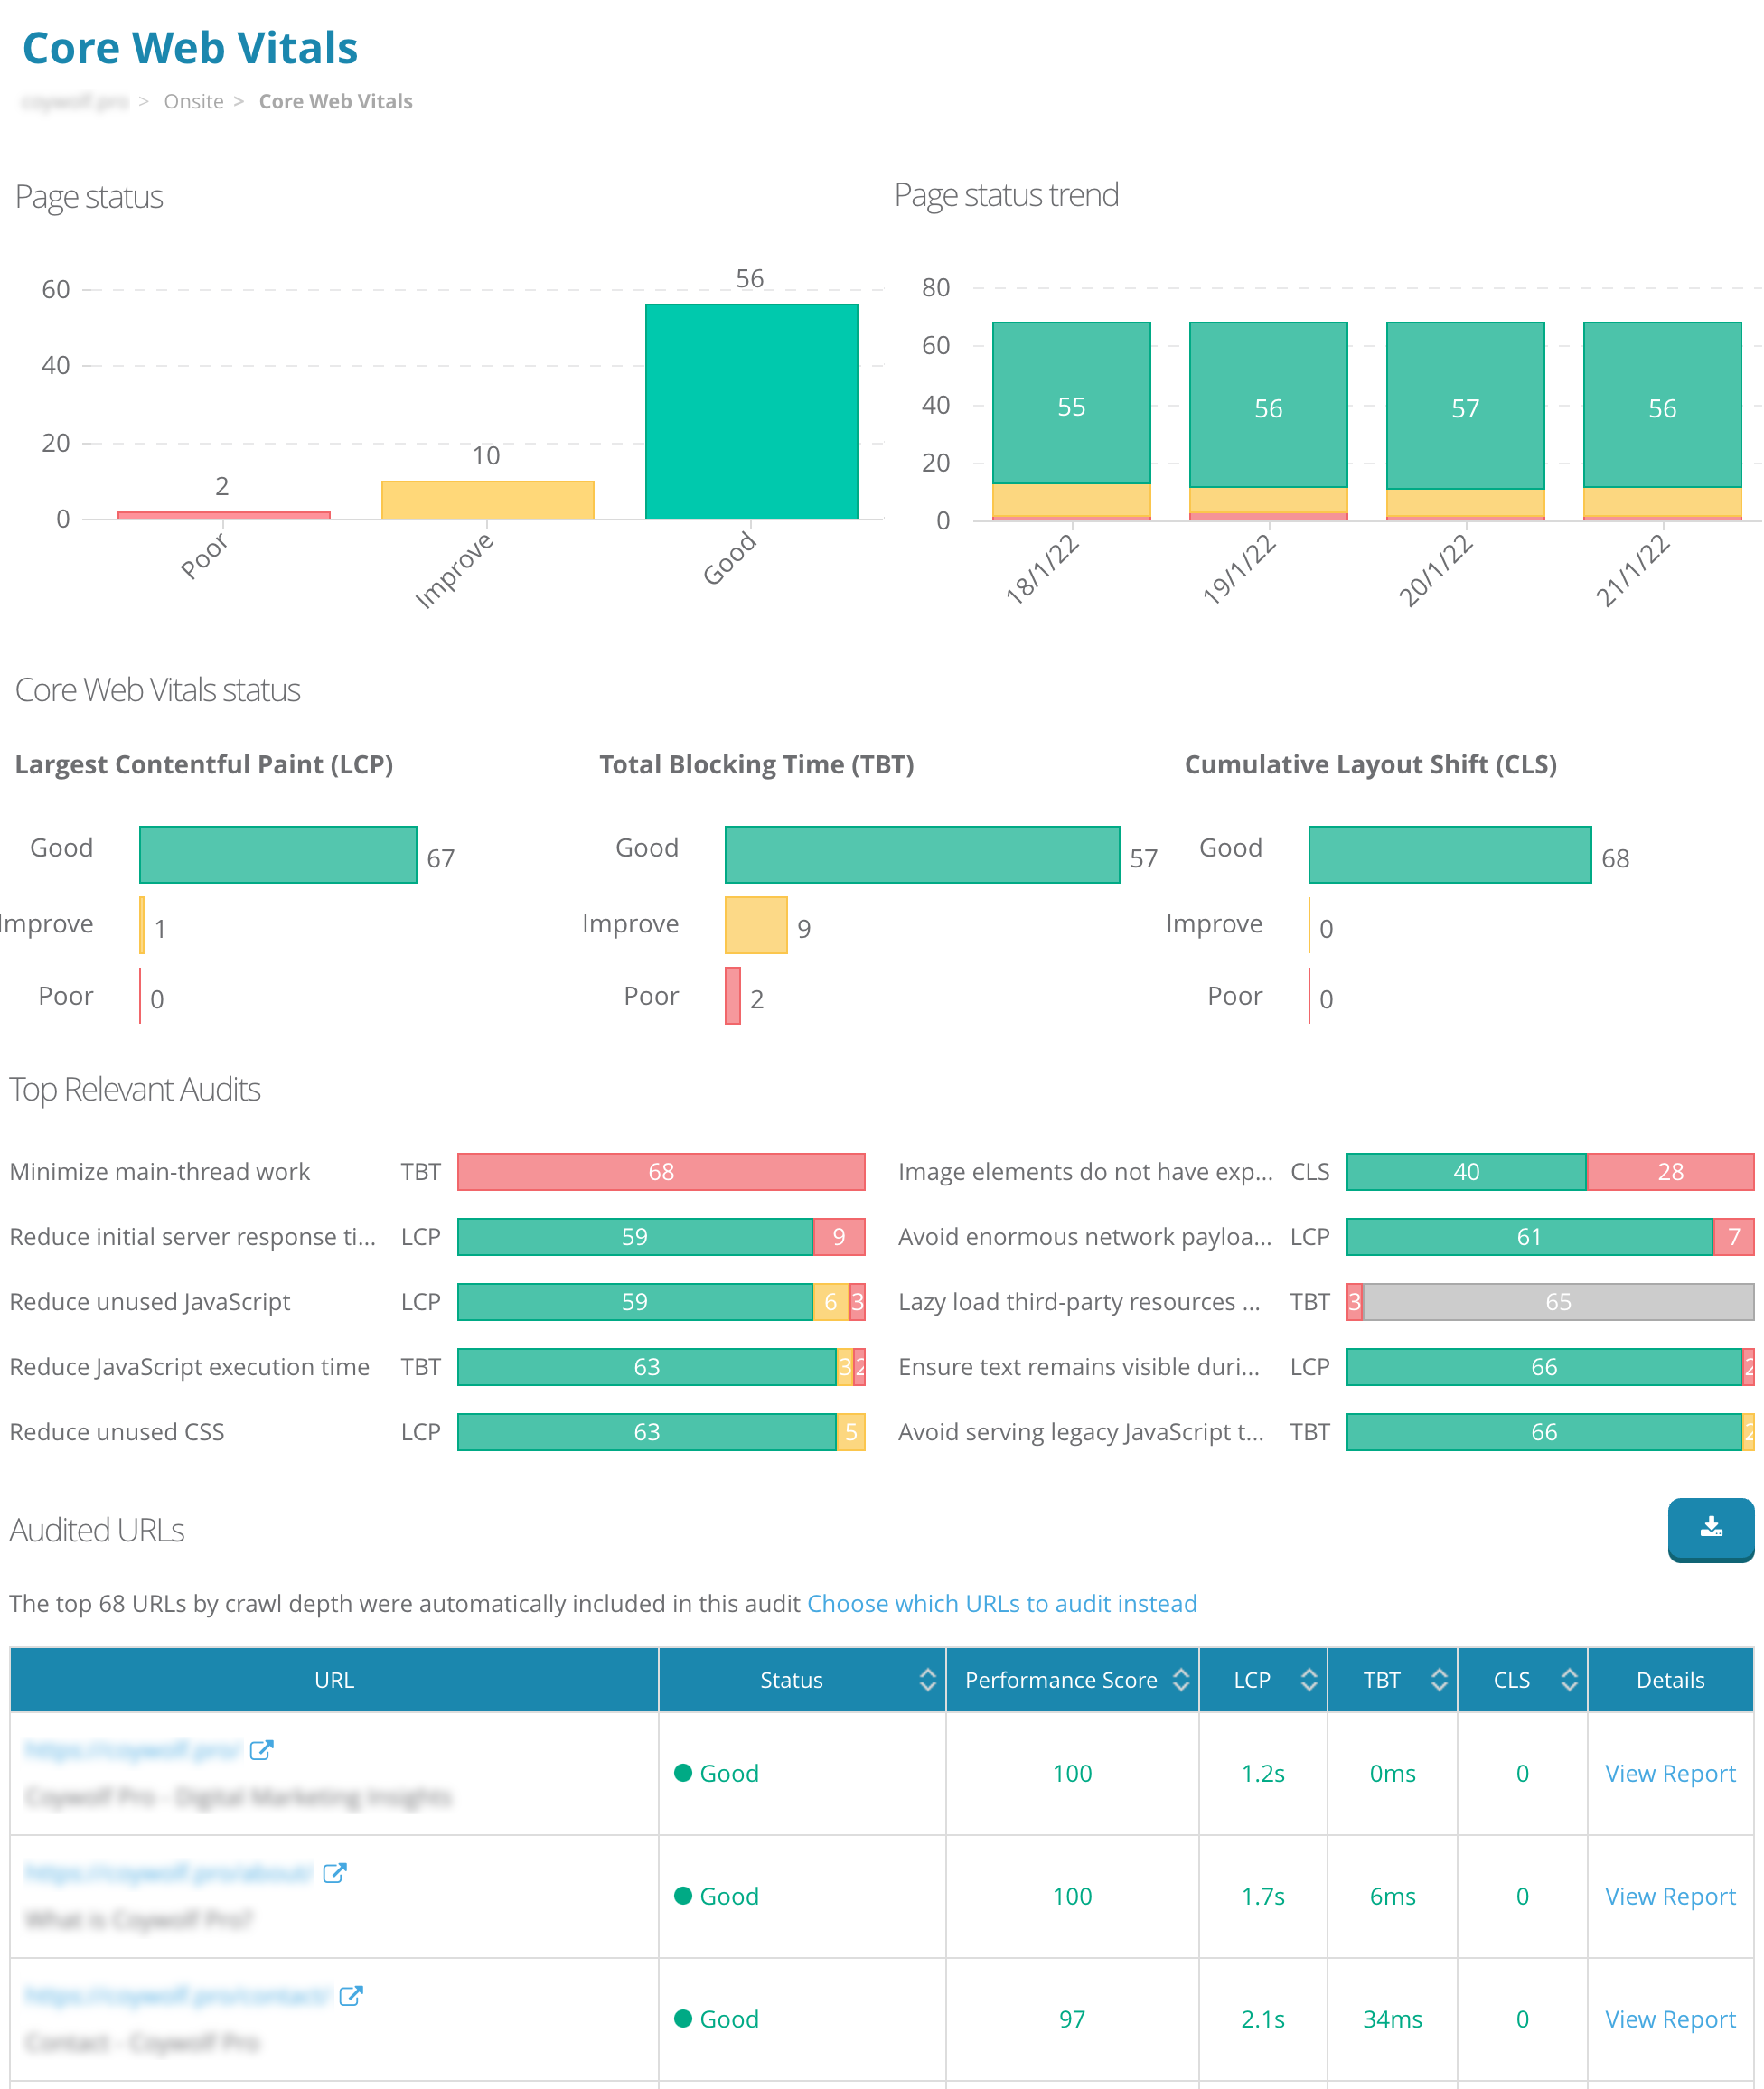
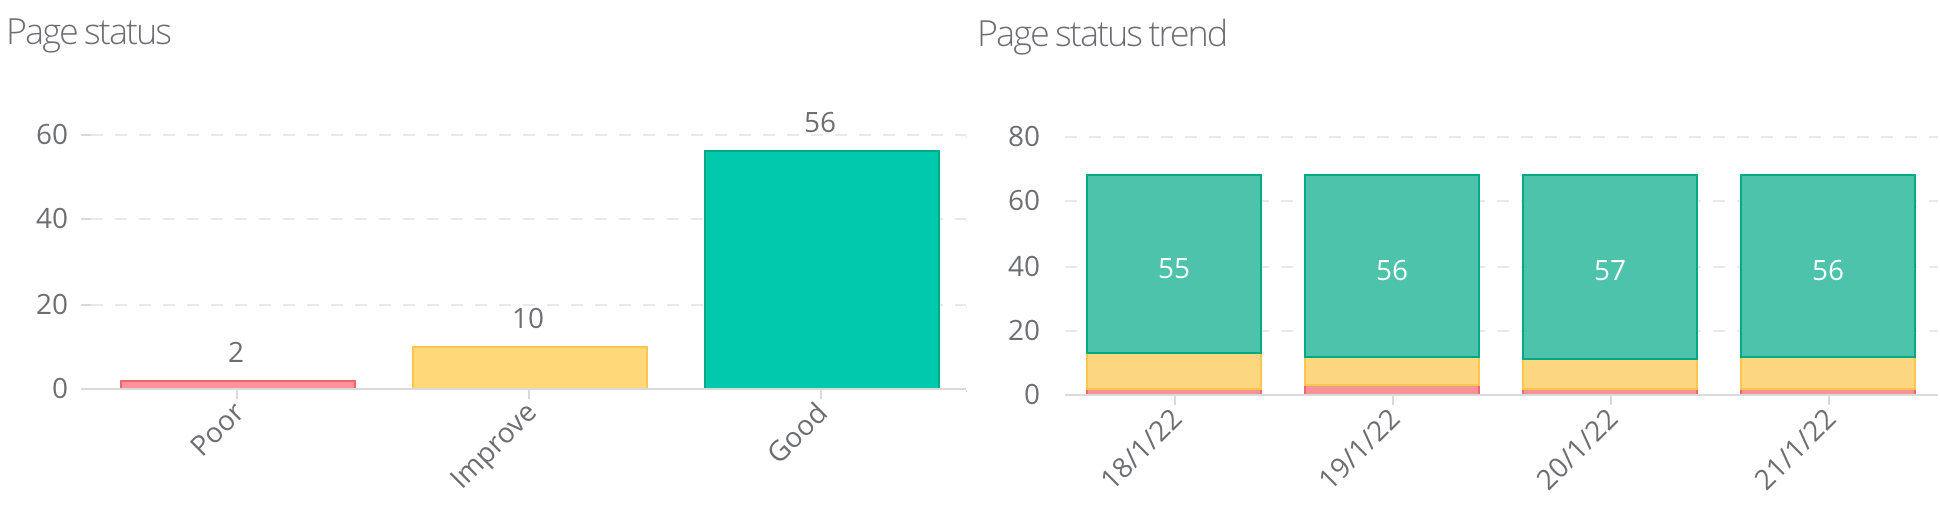
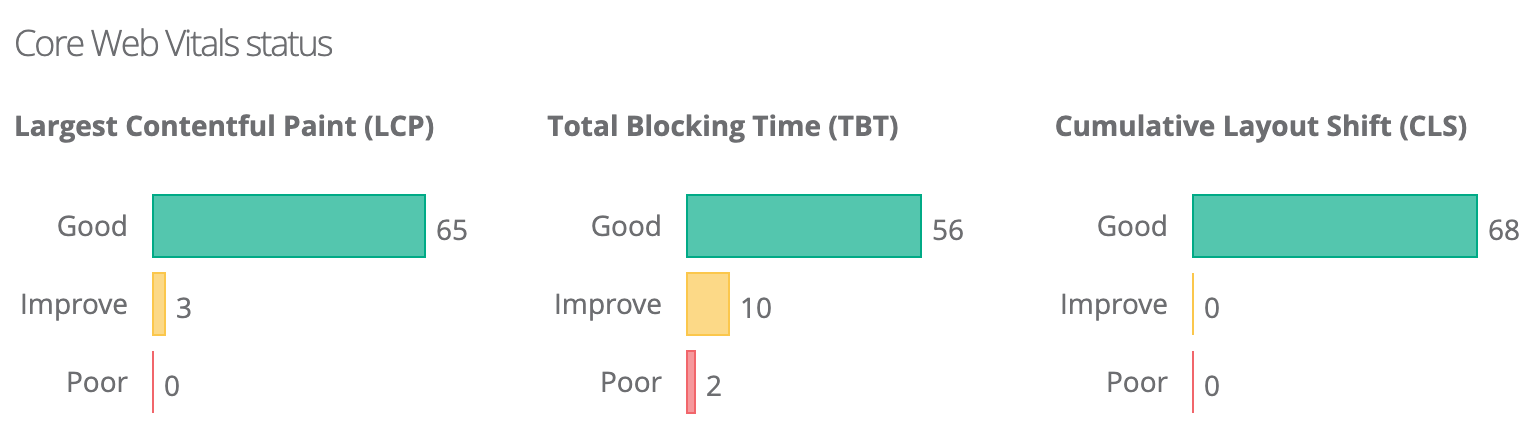
The top of the report shows a breakdown and trend of the each page’s Core Web Vitals status.
Each of the 3 Core Web Vitals can be broken into ranges that Google as defined as Good, Needs Improvement, or Poor.
The lowest score determines the status of the page — if just one Core Web Vital is Poor, the Page Status for this URL will be Poor. Only URLs where all 3 Core Web Vitals are Good will have a Page Status of Good.
These ranges are broken down for each Core Web Vital as well. The charts show the number of URLs in each category for each metric.
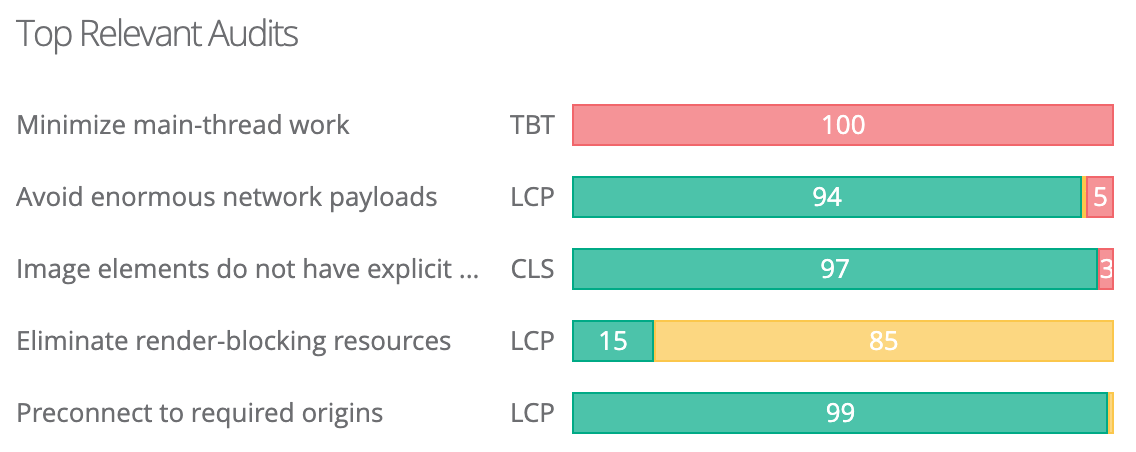
In addition to the 3 Core Web Vitals, there are over 80 additional metrics included in Dragon Metrics' performance audit reports. Some of these are Opportunities or Diagnostics defined by Google as Relevant Audits.
These Relevant Audits include suggestions and detailed information about the performance of your site’s performance. Each relevant audit is related to a Core Web Vital, so fixing the audit will typically contribute to an improvement in the Core Web Vital and Performance Score.
The 10 Relevant Audits with the highest number of Poor or Needs Improvement URLs will be shown on this report.
Hover on a relevant audit for more information.
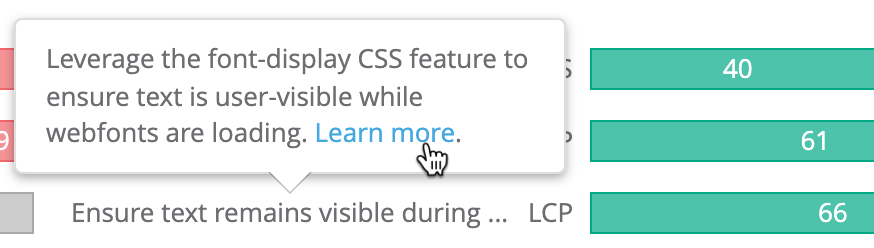
Click the link for a detailed explanation of the issue and how to improve it.

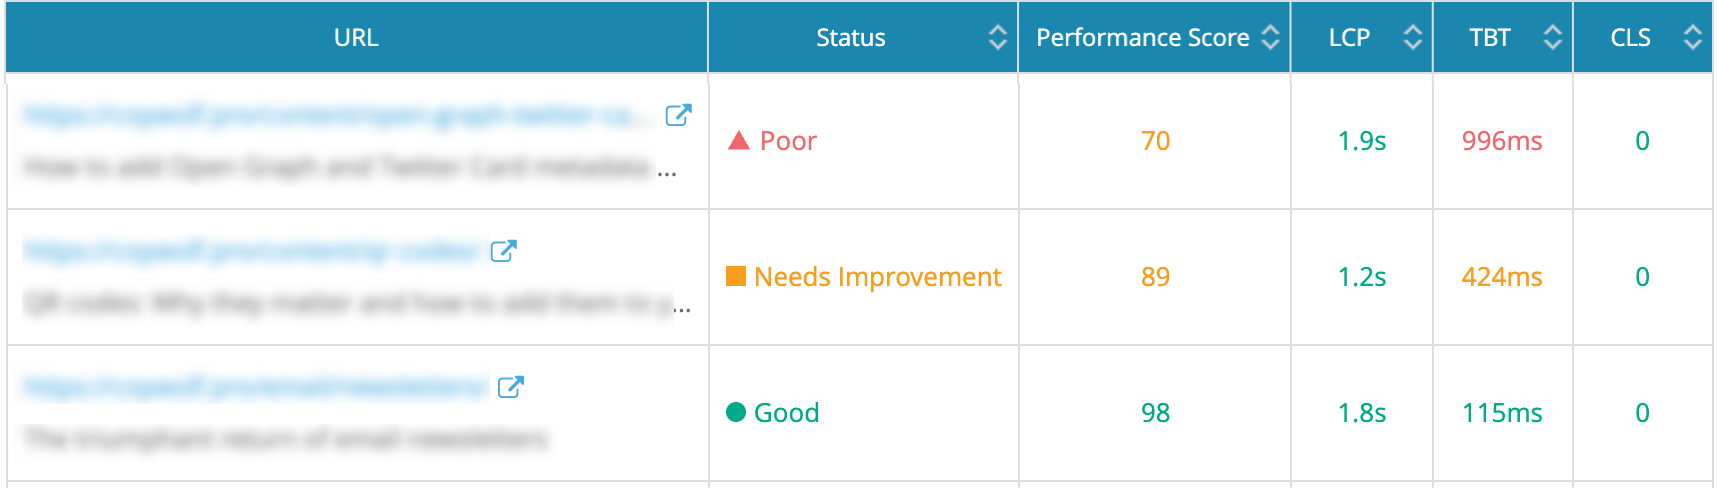
The performance of each URL is shown in the table below, and can be exported to Excel by clicking the button in the upper right.
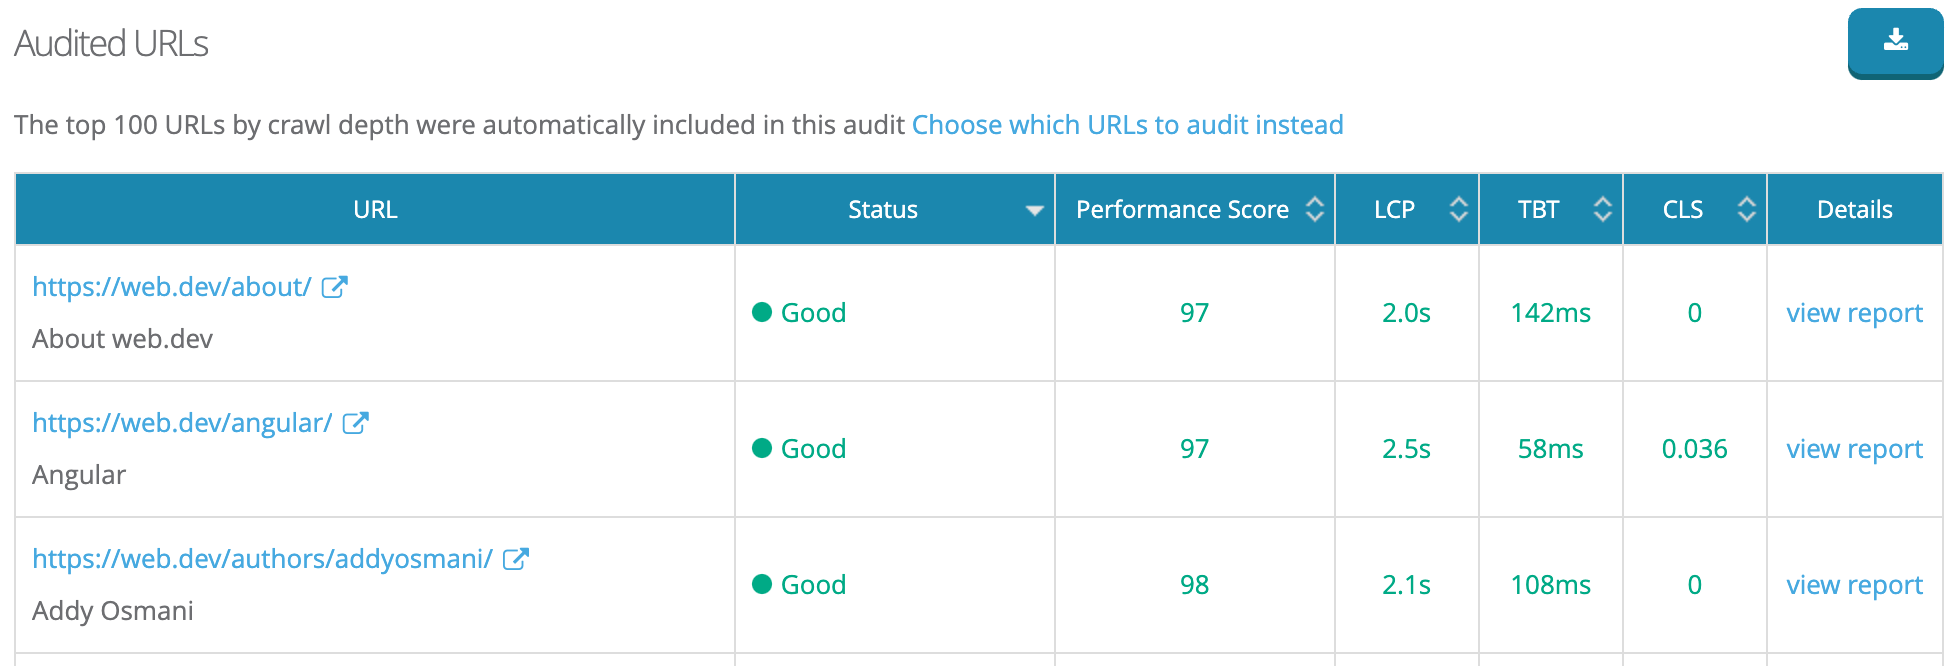
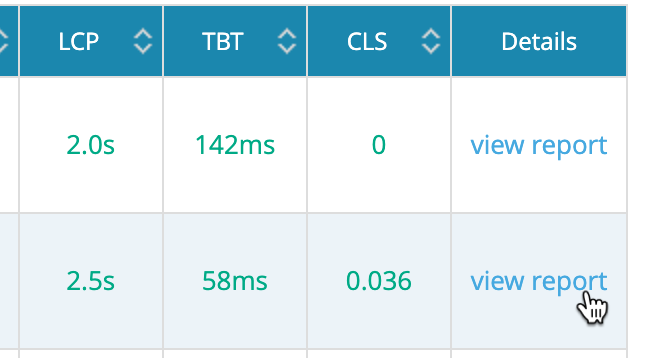
Click view report to see the detailed report, including breakdowns of each audit and in-depth recommendations.
These in-depth reports open in the new Page Speed tab on URL X-Ray, and provide an incredible level of detail on the page’s performance.
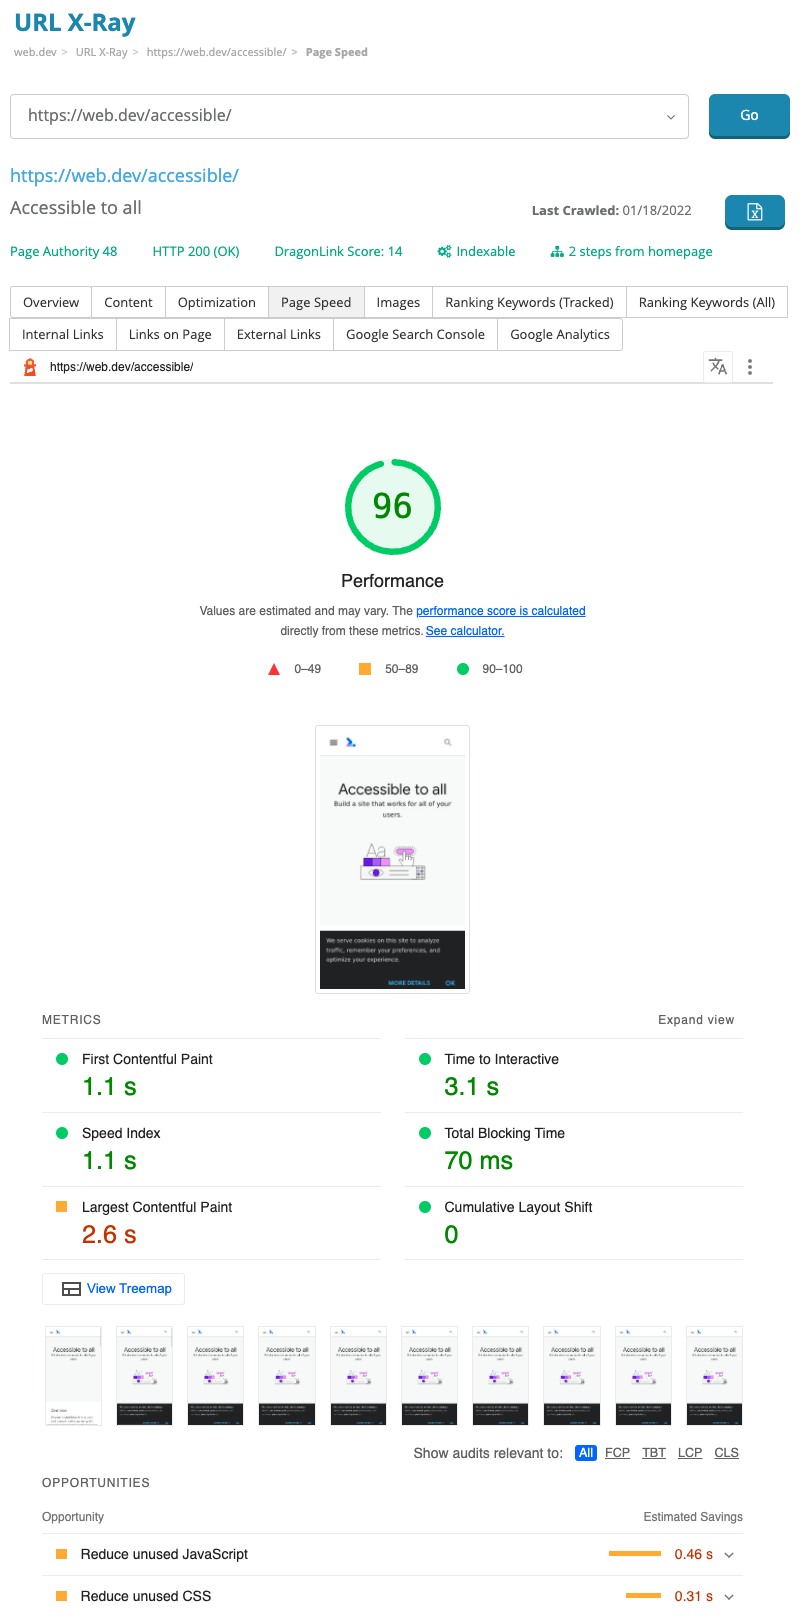
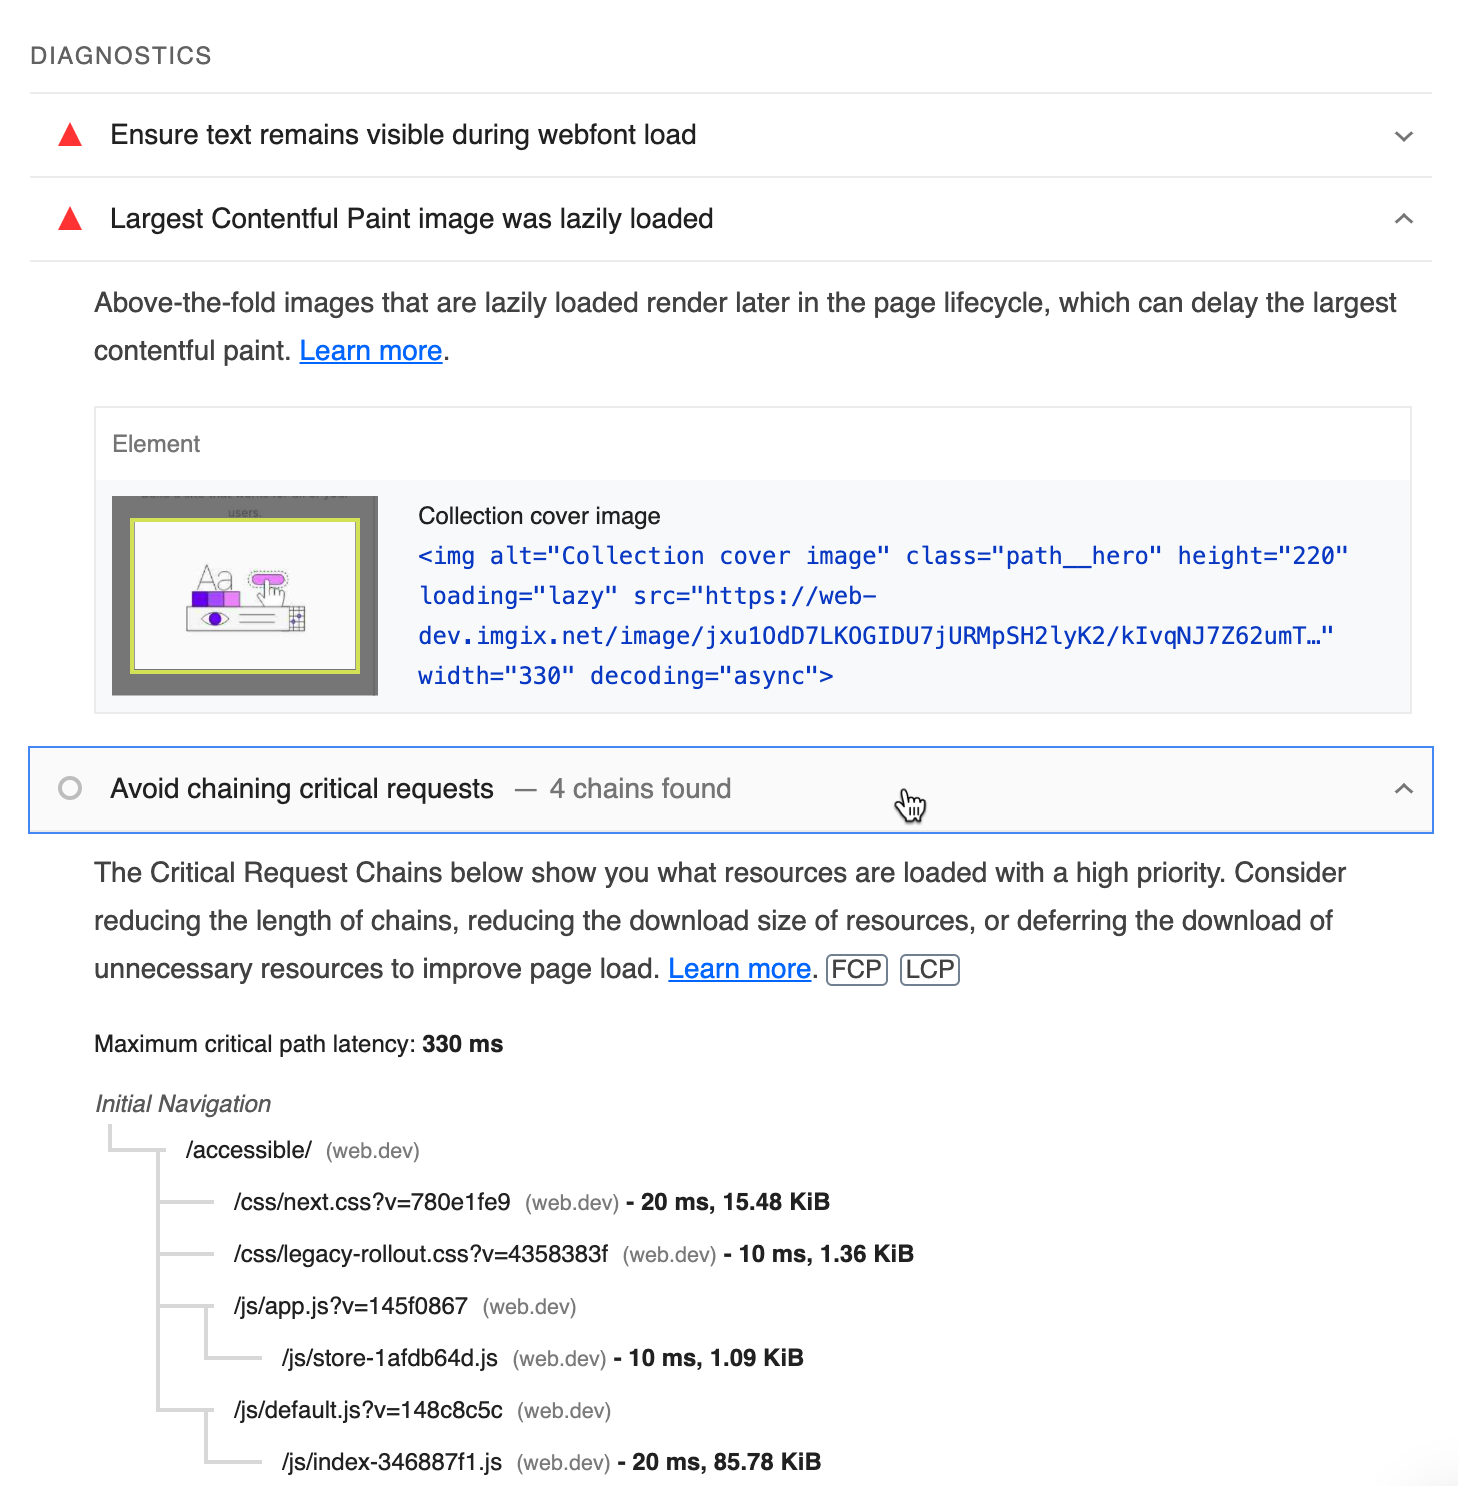
Click on each Opportunity or Diagnostic to reveal detailed recommendations on how to improve each one.
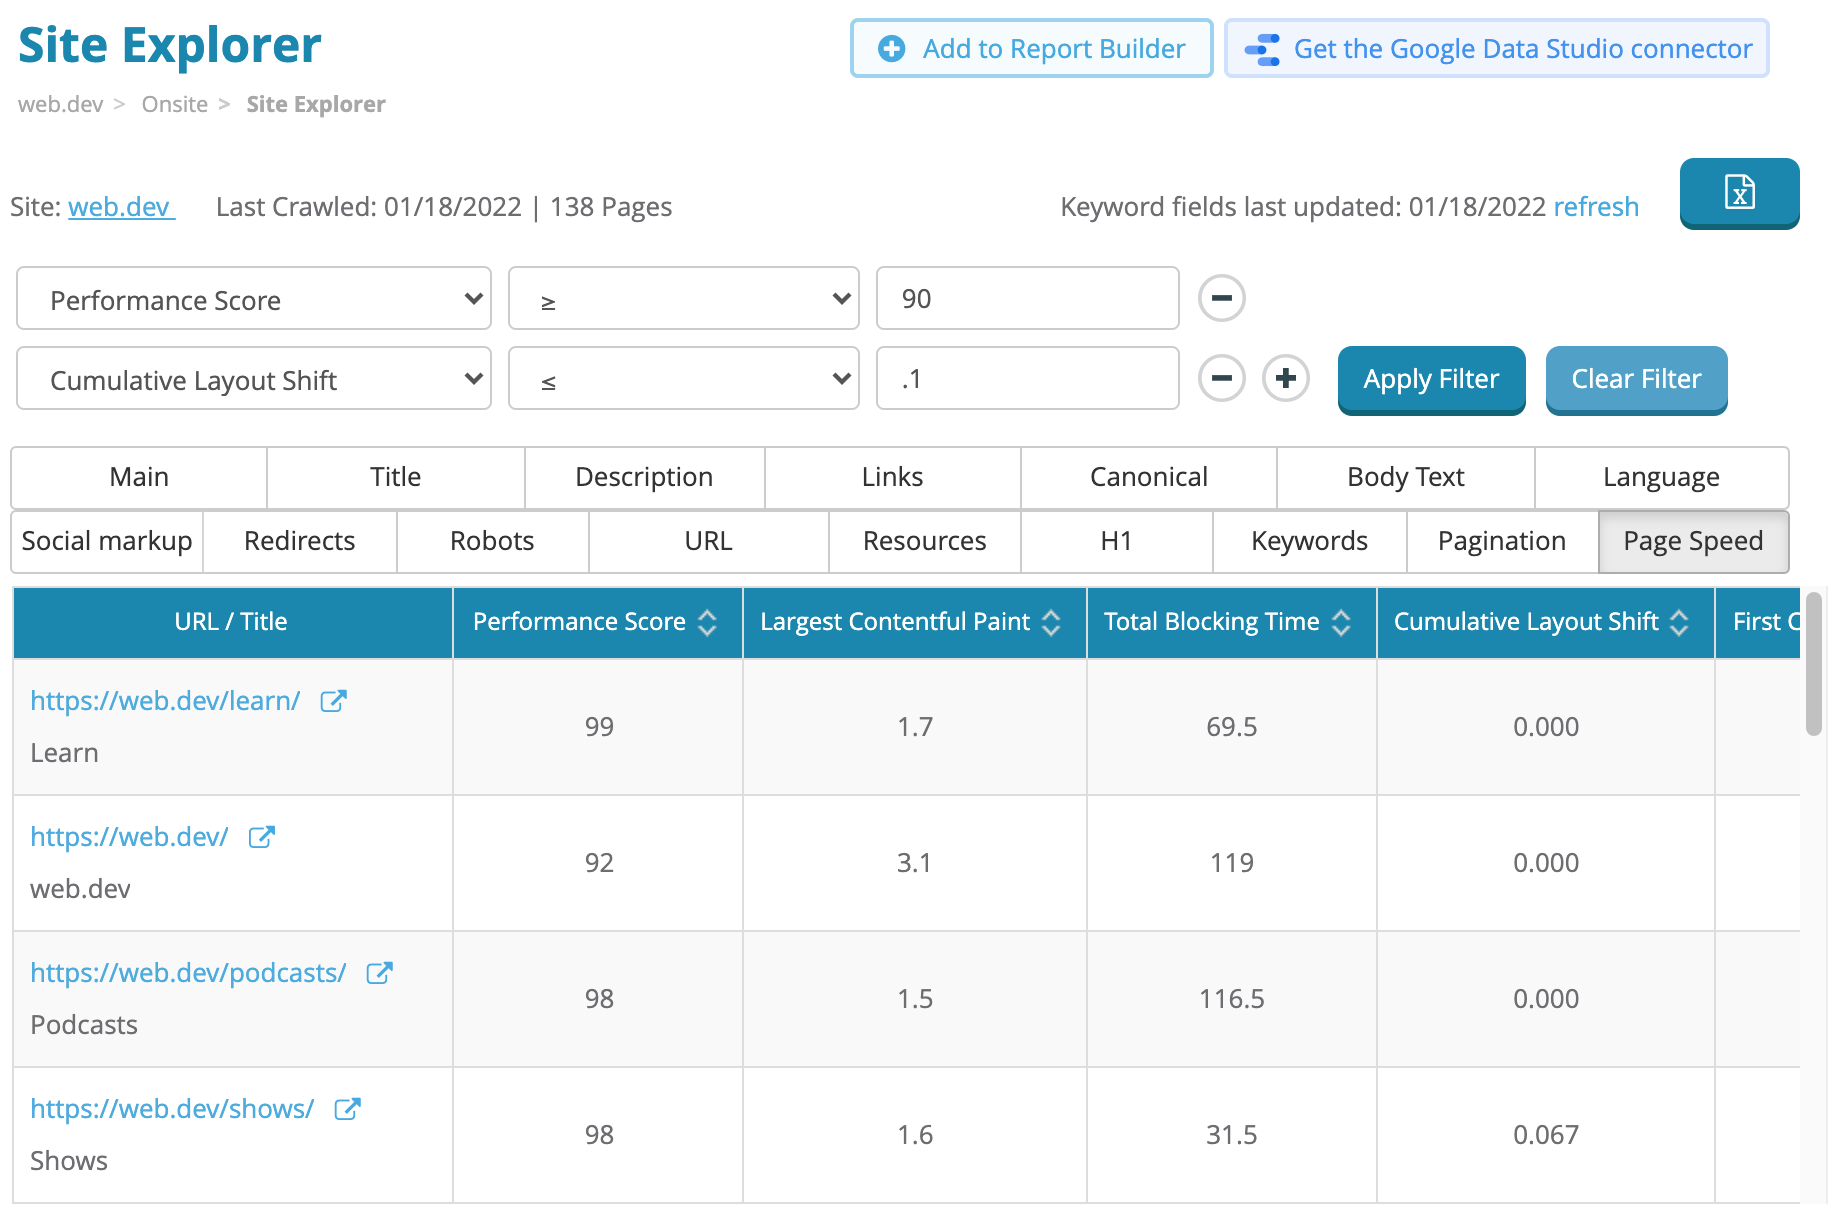
All 80 of the new page speed metrics are available in the new Site Explorer. Just like the other 120+ metrics, you can filter by any field to find URLs that meet any criteria you set. Export to Excel to get data for all URLs in bulk.
Today’s launch is still in public beta. We’re confident that the majority of the bugs have been worked out, but over the next couple of months we’ll be monitoring the rollout closely and potentially making some adjustments as needed.
As always (and especially for beta features), we welcome any suggestions, feedback, or bug reports you may have.
Today you’ll find the new page speed data in Core Web Vitals, URL X-Ray, and Site Explorer. In the very near future, you’ll start to see recommendations for each Core Web Vital and relevant audit in the Site Auditor as well.
For now, the number of URLs audited for Core Web Vitals is set at 100 per campaign. This is across all plans and subscription types. This will be changing in the near future.
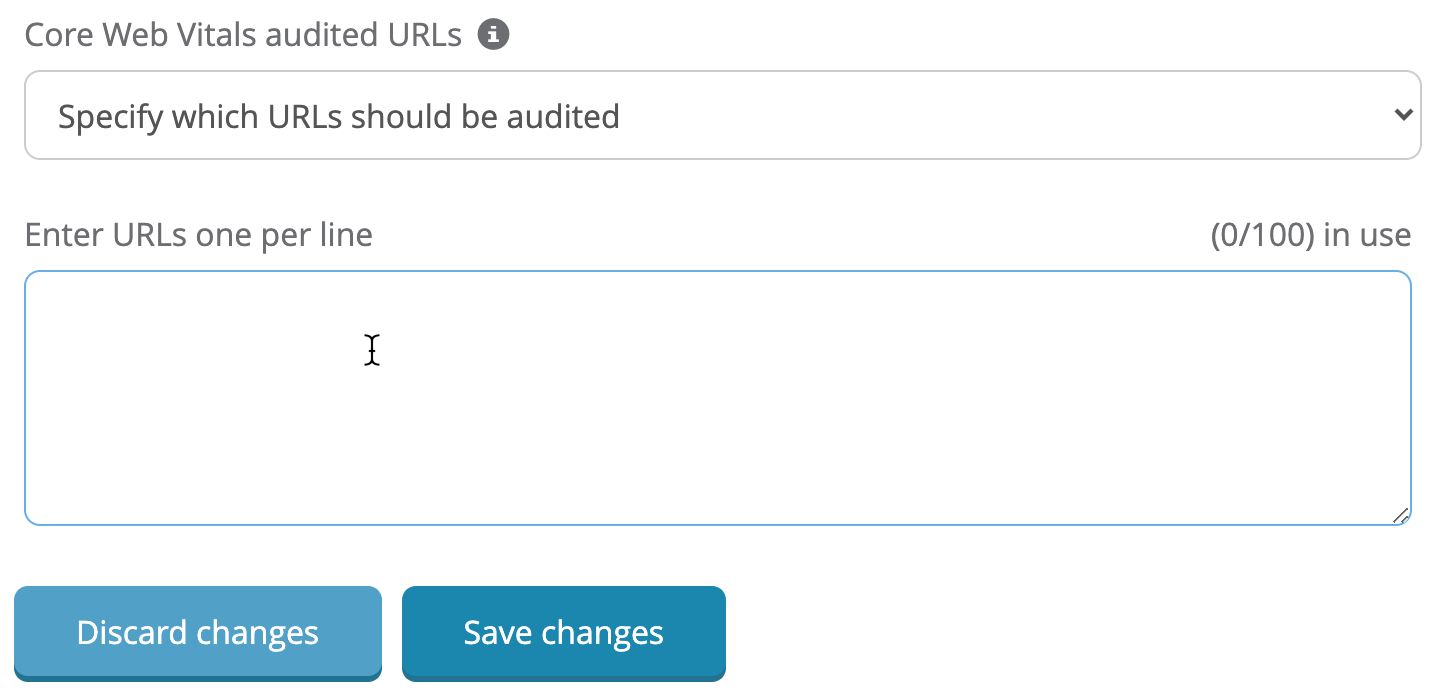
By default, our crawler will try to automatically detect the most relevant URLs to include in the report (e.g. URLs with the most traffic, backlinks, highest rankings, or closest to the home page), but you can control which URLs should be audited instead.
Simply navigate to Campaign Settings > Crawler and paste in the URLs you prefer to include instead.
While 100 URLs may not seem like a lot (especially for very large sites), by choosing a representative URL from each major template in your CMS, most issues can still be uncovered even with a limited number of pages audited.
When measuring each URL’s Core Web Vitals status for their Page Experience update, Google uses data from how actual users are interacting with your site (field data). The high-level data in Google Search Console also shows field data.
Since detailed field data is unavailable at scale, Dragon Metrics uses an open-source tool called Google Lighthouse to audit your site’s performance (lab data).
This means that you may see some differences between the data shown in Dragon Metrics and what you find in Google Search Console. Let’s take a look at what some of these differences may be, and what they mean.
Since First Input Delay (FID) is based on real user interaction (which is not available in a lab environment), Dragon Metrics uses Total Blocking Time (TBT) as a stand-in for this metric, which Google recommends as a proxy for FID when using lab data.
While these metrics are calculated differently, they are closely related, so optimizing for a good TBT will typically result in a good FID as well.
In contrast to field data which is collected from a large sample of real user data, lab data collected using a tool like Google Lighthouse depends on the physical location, network speed, and speed of the machine running the test.
This means that without the proper controls, it’s possible for people to get wildly different results from each other when running lab tools like Lighthouse.
In order to arrive at standard results, it’s important to use network and CPU throttling effectively and follow strict guidelines on accounting for variability.
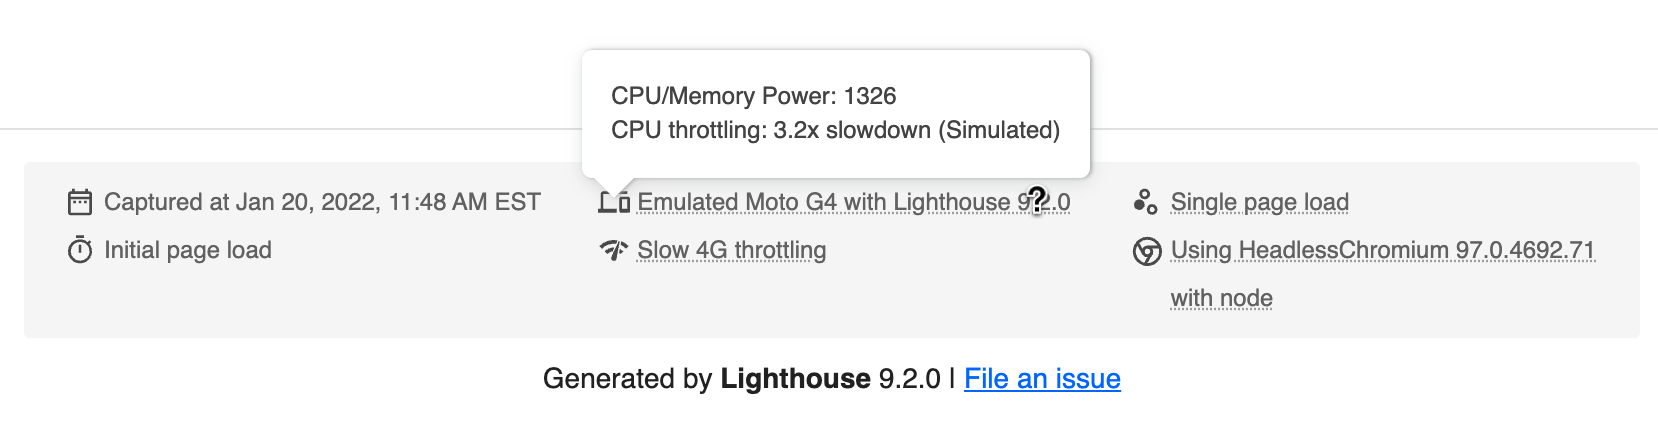
We follow Google’s recommendations on best practices for ensuring we’re auditing sites as similar to Google’s PageSpeed Insights tool as possible. After rigorous optimization and testing, we find our crawlers results are very close to that of Google PageSpeed Insights.
Here’s a detailed look at the Lighthouse configuration Dragon Metrics uses when auditing sites.
The best part is that the new Core Web Vitals update is live right now. Sign into your Dragon Metrics account to check it out, and let us know what you think!