The Ultimate Ranking Dashboard — Introducing Ranking Overview
Dragon Metrics offers a huge number of ways to visualize your keyword ranking data — 14 reports at last count. These reports allow SEOs to get exactly the level of detail they need, whether it’s a high-level position distribution report, a detailed look at all top 50 results for a single keyword, or anything in-between. But sometimes, it may not be clear where to get started. With all of these reports, what should we investigate first?
That’s why today we’re launching Ranking Overview, which shows the highlights from all of our ranking reports all in one place. It’s the perfect starting point when taking a look at rankings for your site.
There’s a lot here, so let’s dive in!
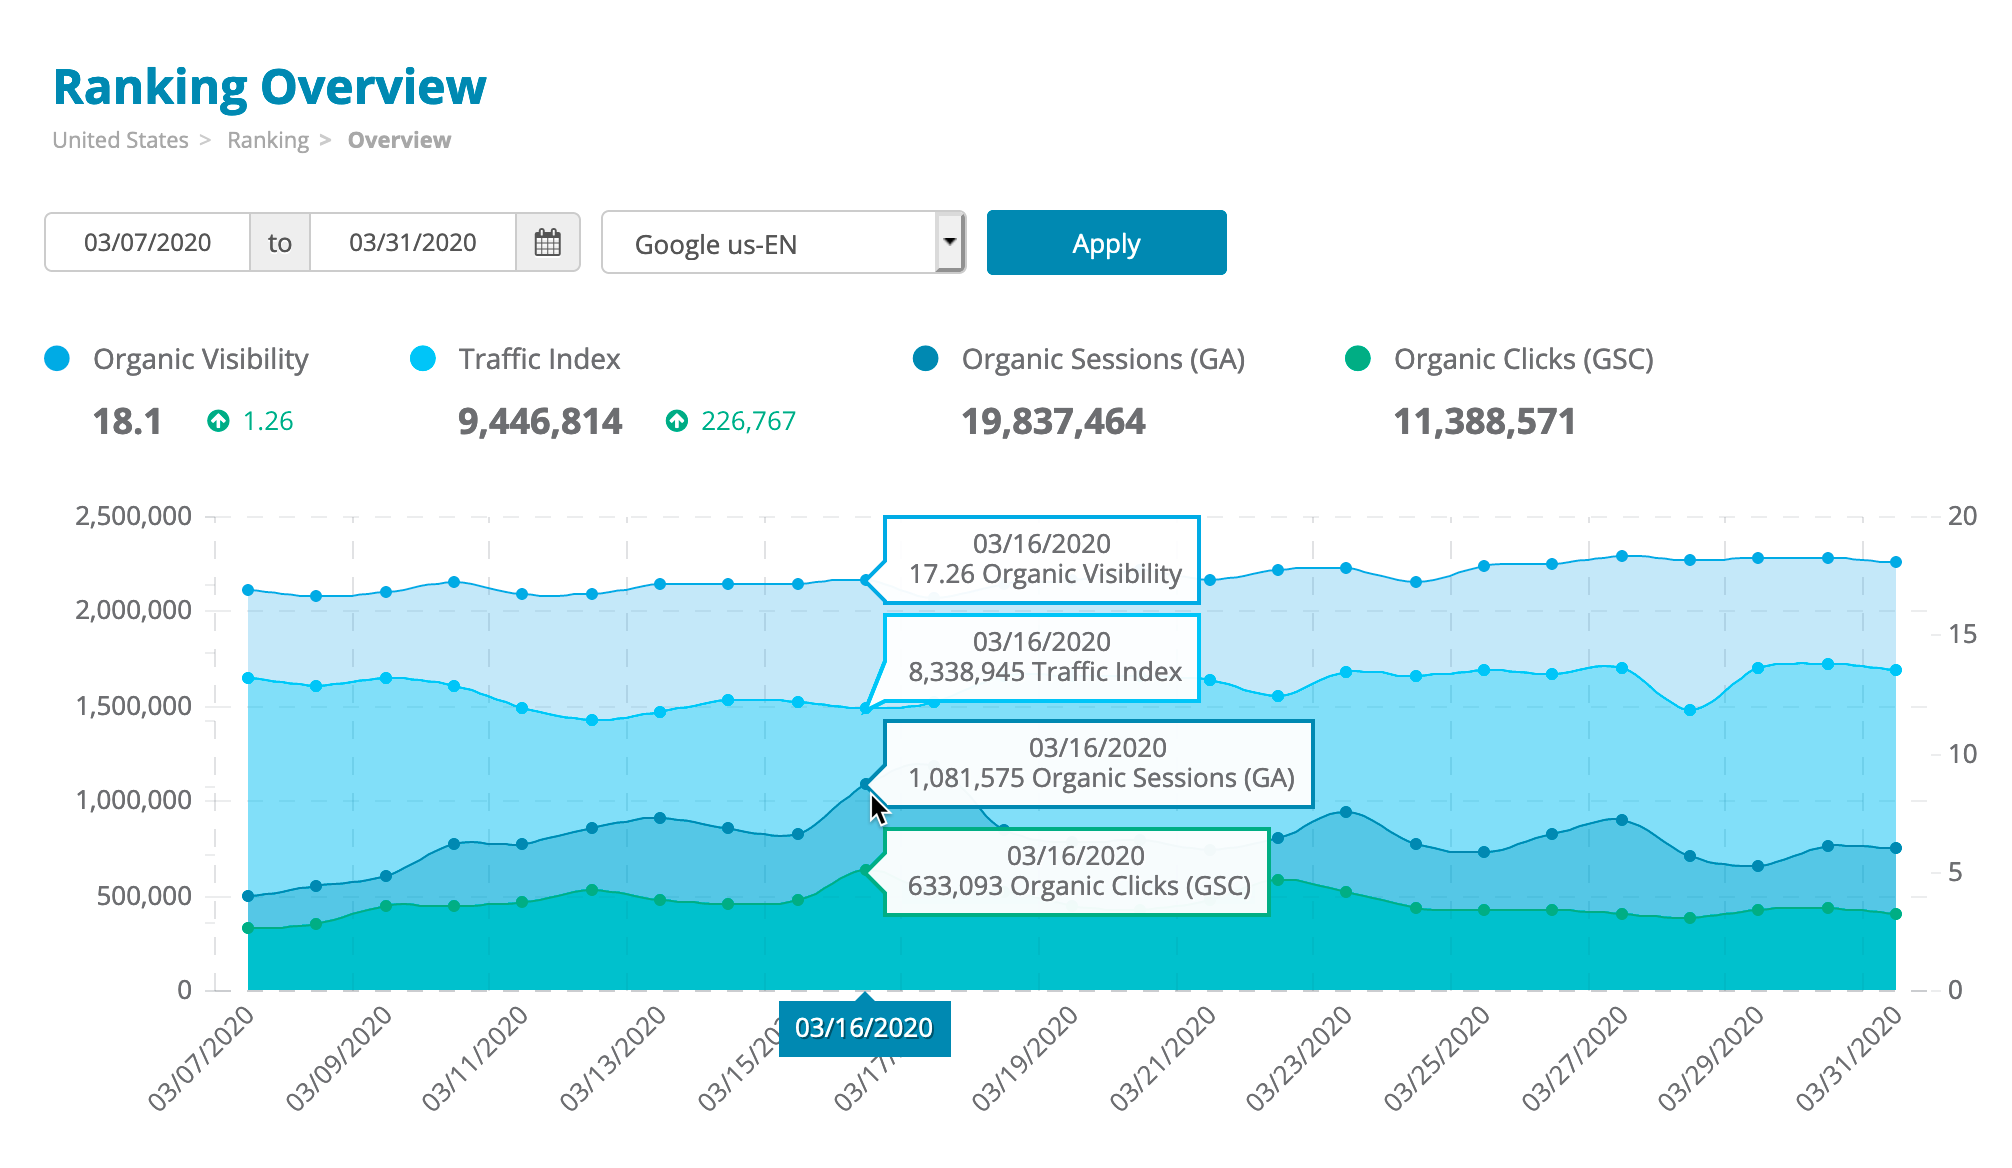
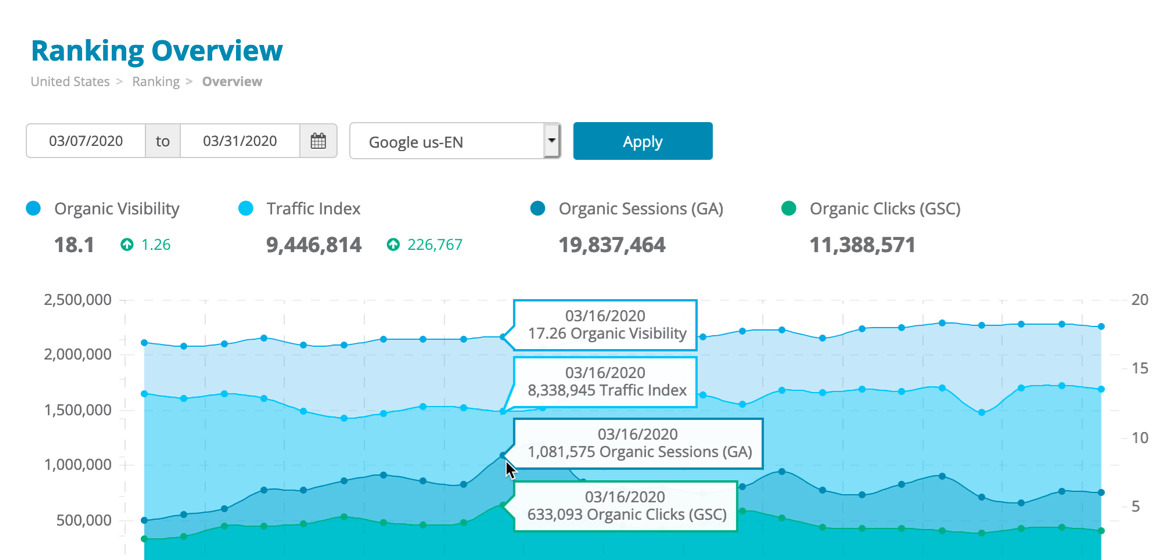
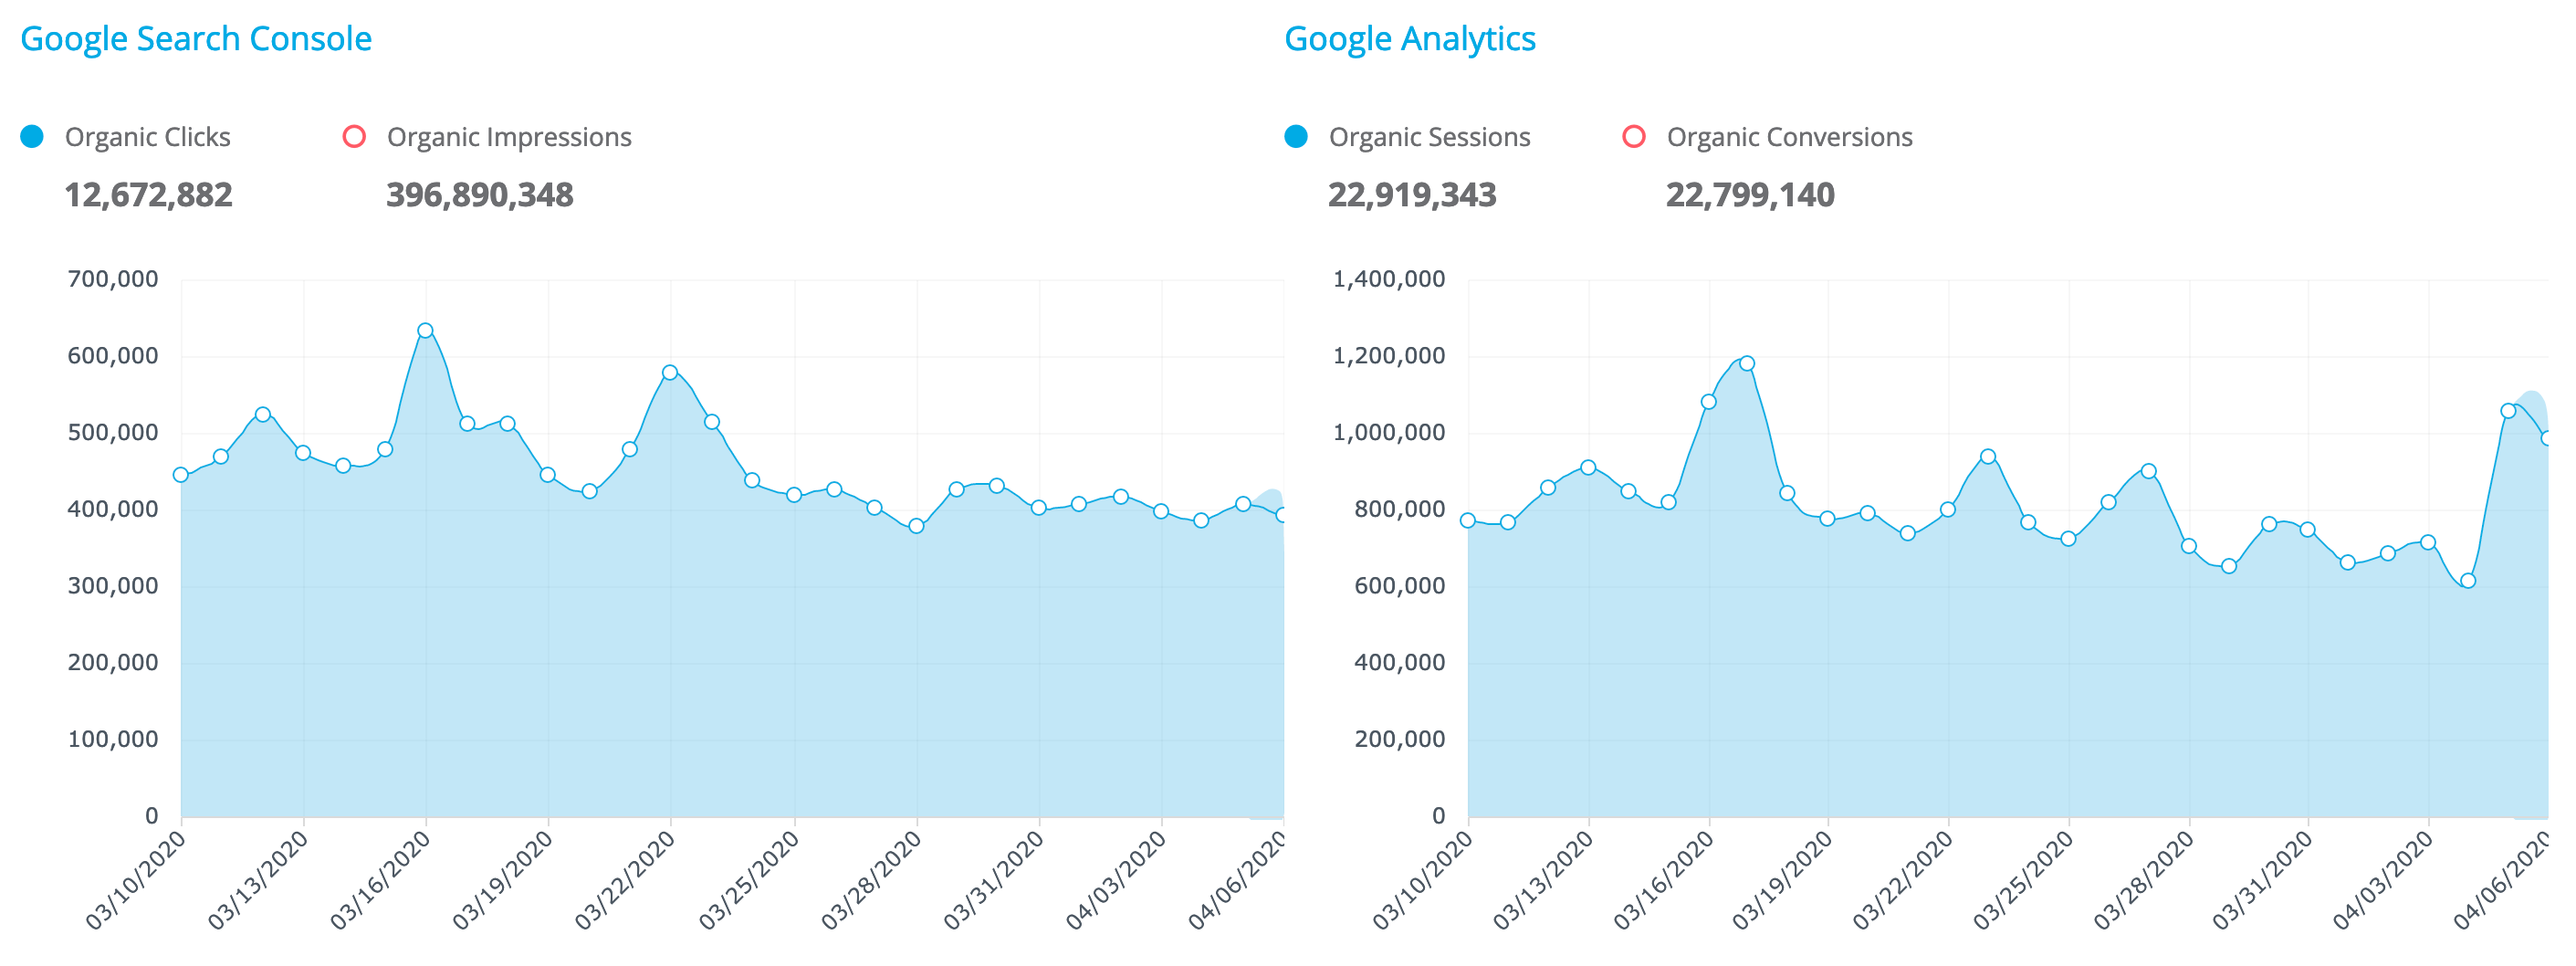
At the very top of the report is a trended chart comparing four high-level metrics:
These metrics are all extremely useful in their own way, but put together all in one chart they become even more so. For example, if Organic Visibility is going up but Traffic Index is going down, this means your average ranking position is improving, but the ranking position is likely declining for keywords with the highest number of searches. If Traffic Index and Organic Visibility is constant, but Organic Sessions is improving, it could mean that more people are clicking on your site on SERPs even if the position remains the same.
Another example is comparing Google Analytics Organic Sessions and Google Search Console Clicks. In theory, you’d think these should line up exactly. After all, they’re both coming from Google, right? While they should be correlated, they’re typically never exactly the same due to differences in how they’re calculated. By looking at them side-by-side, we can get a much better picture of our organic performance than looking at only one at a time.
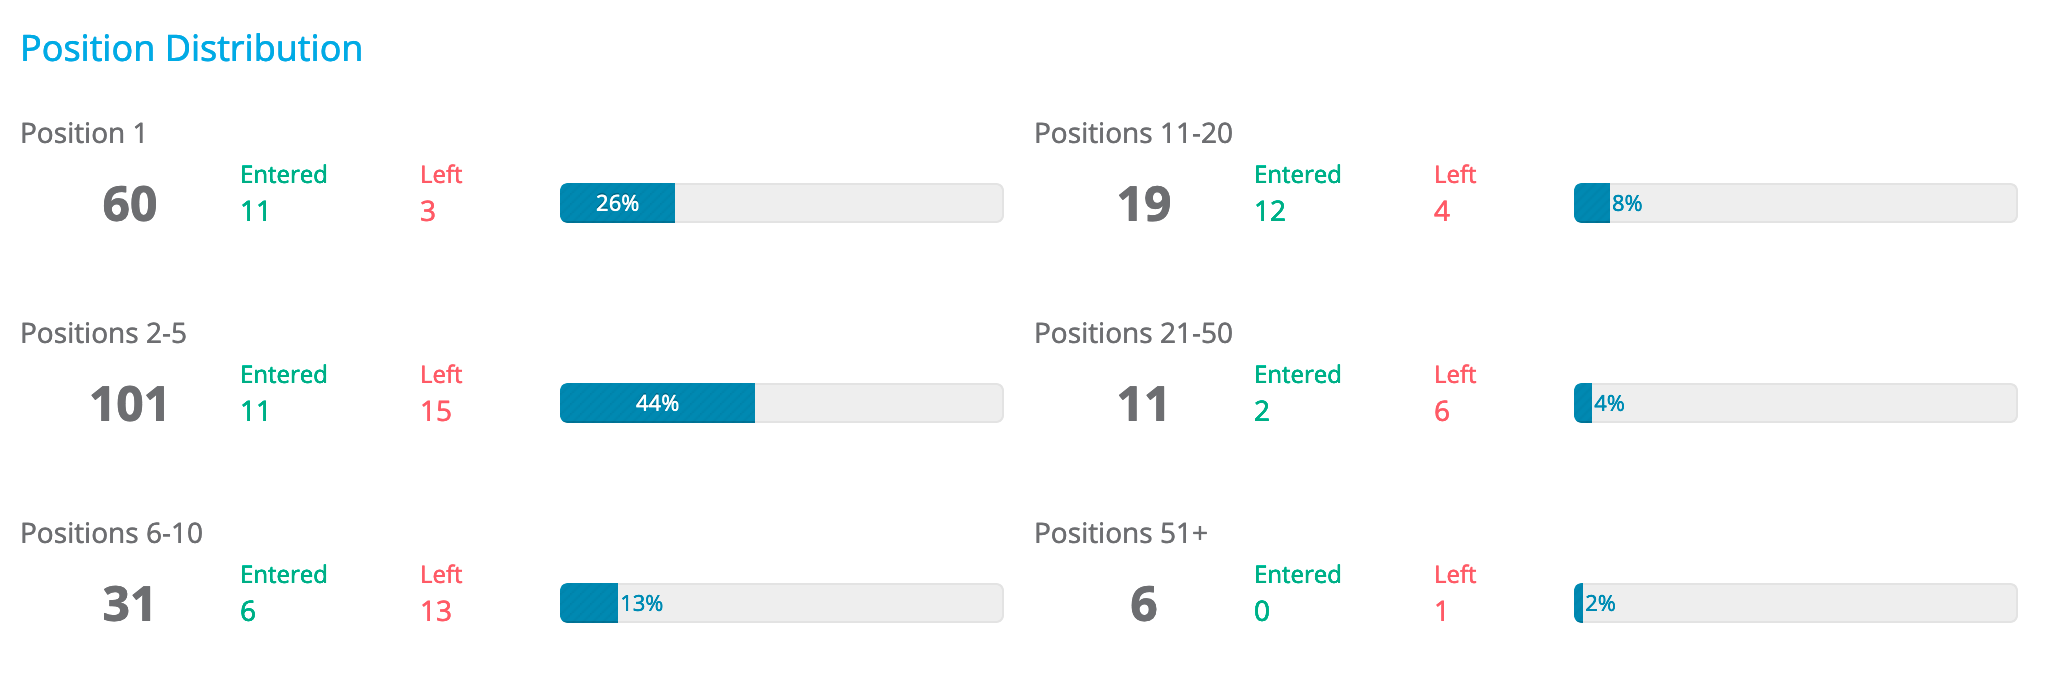
Next up is a ranking position distribution, showing how many keywords are ranking at each position.
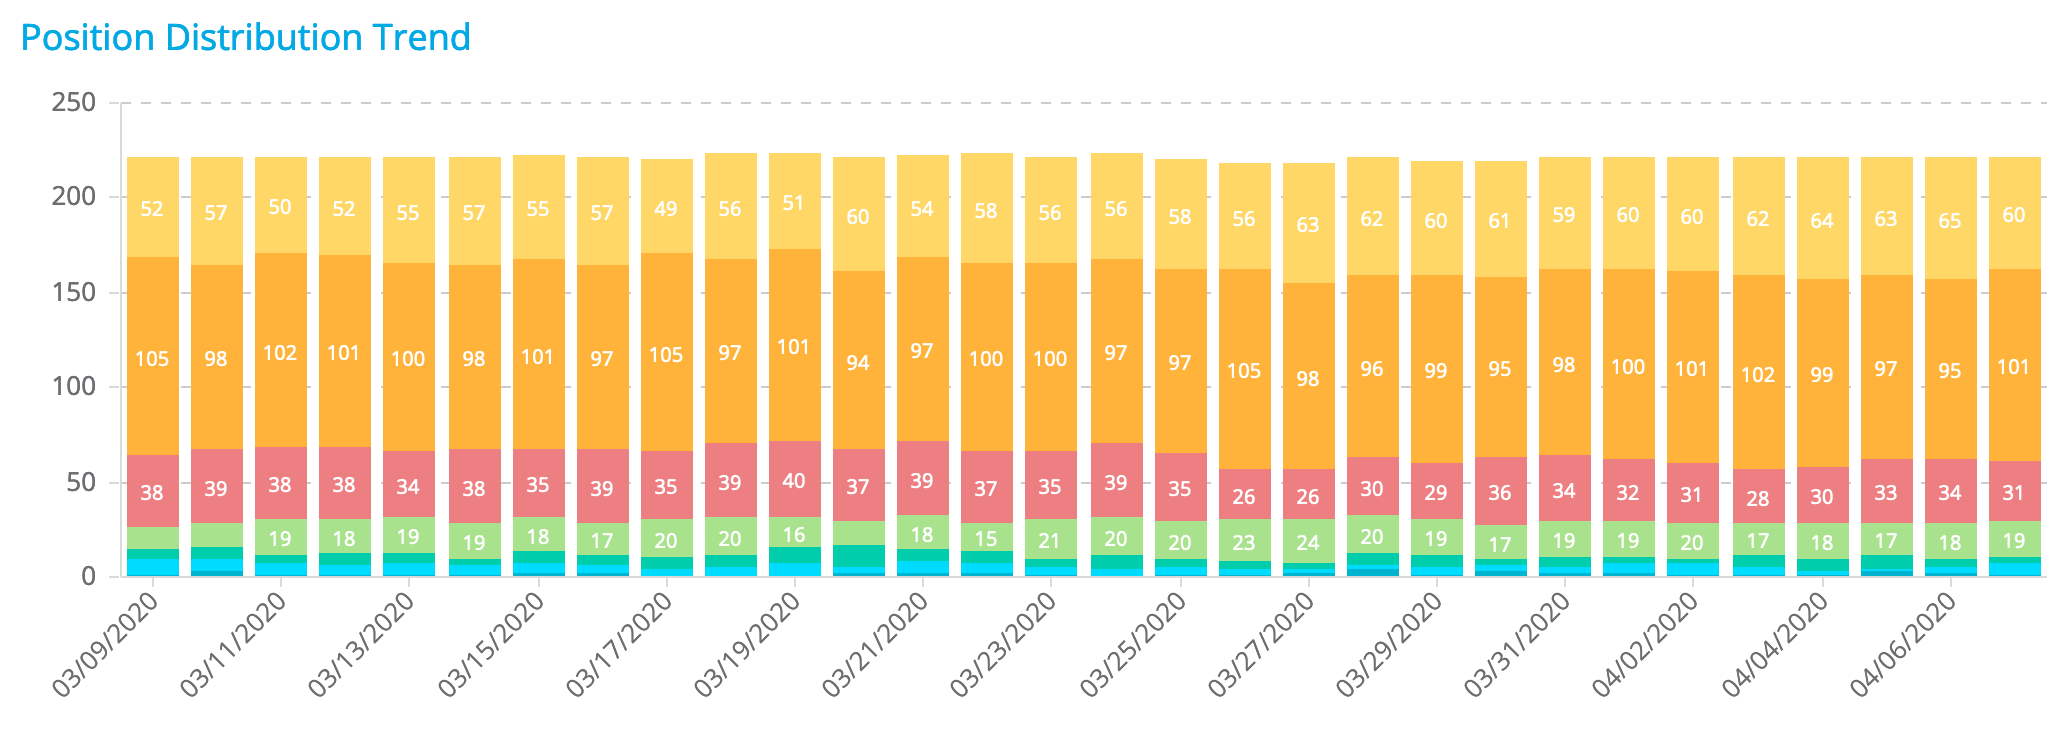
You can also see this on a trend chart below to see how this may have changed over time.
Here’s where things get even cooler — next to each position group is the number of keywords that entered or left. In the example below, we can see that at the end of the date range there were 60 keywords at position 1. This is an increase of 8 keywords from the beginning of the date range — 11 keywords that were not a position 1 are now at position 1, and 3 keywords that were at position 1 are no longer at position 1.
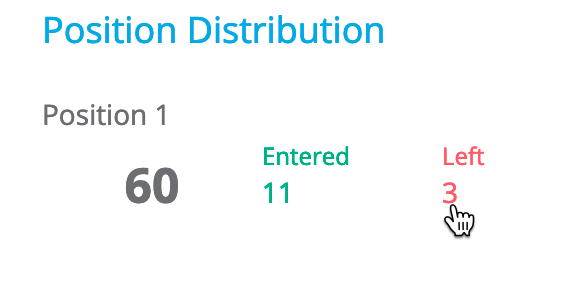
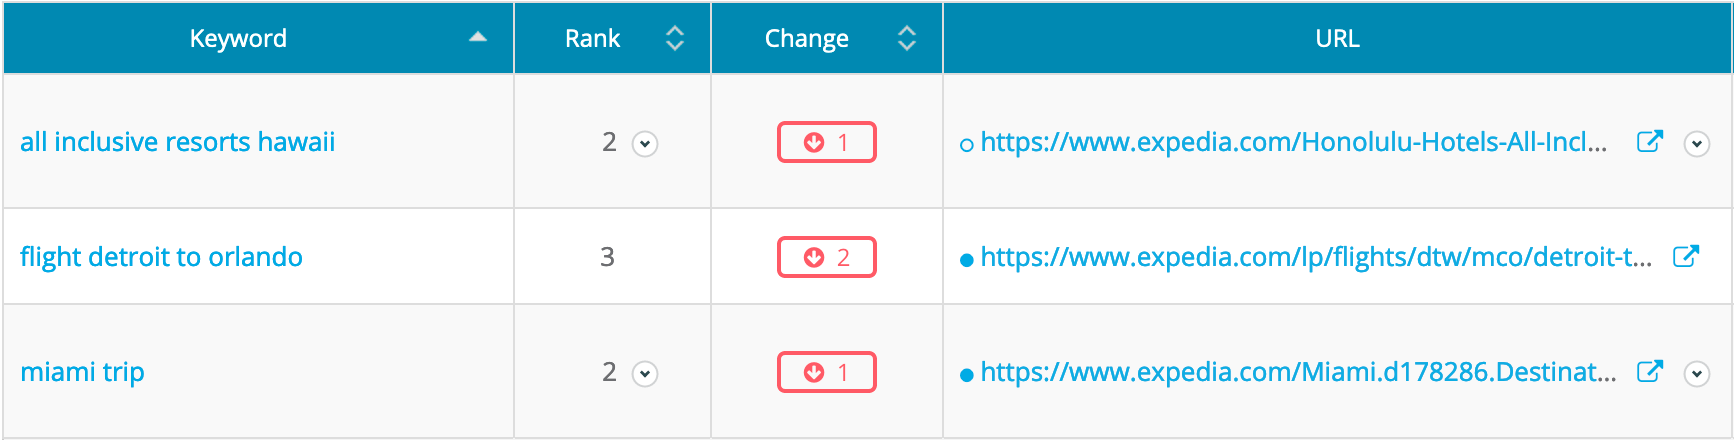
Clicking on the number will take you to the Keyword Ranking report showing all the keywords in this group. So clicking the 3 in this example will show you the keywords that were originally at position 1 but are no longer there.
Below the position distribution are three keyword areas:
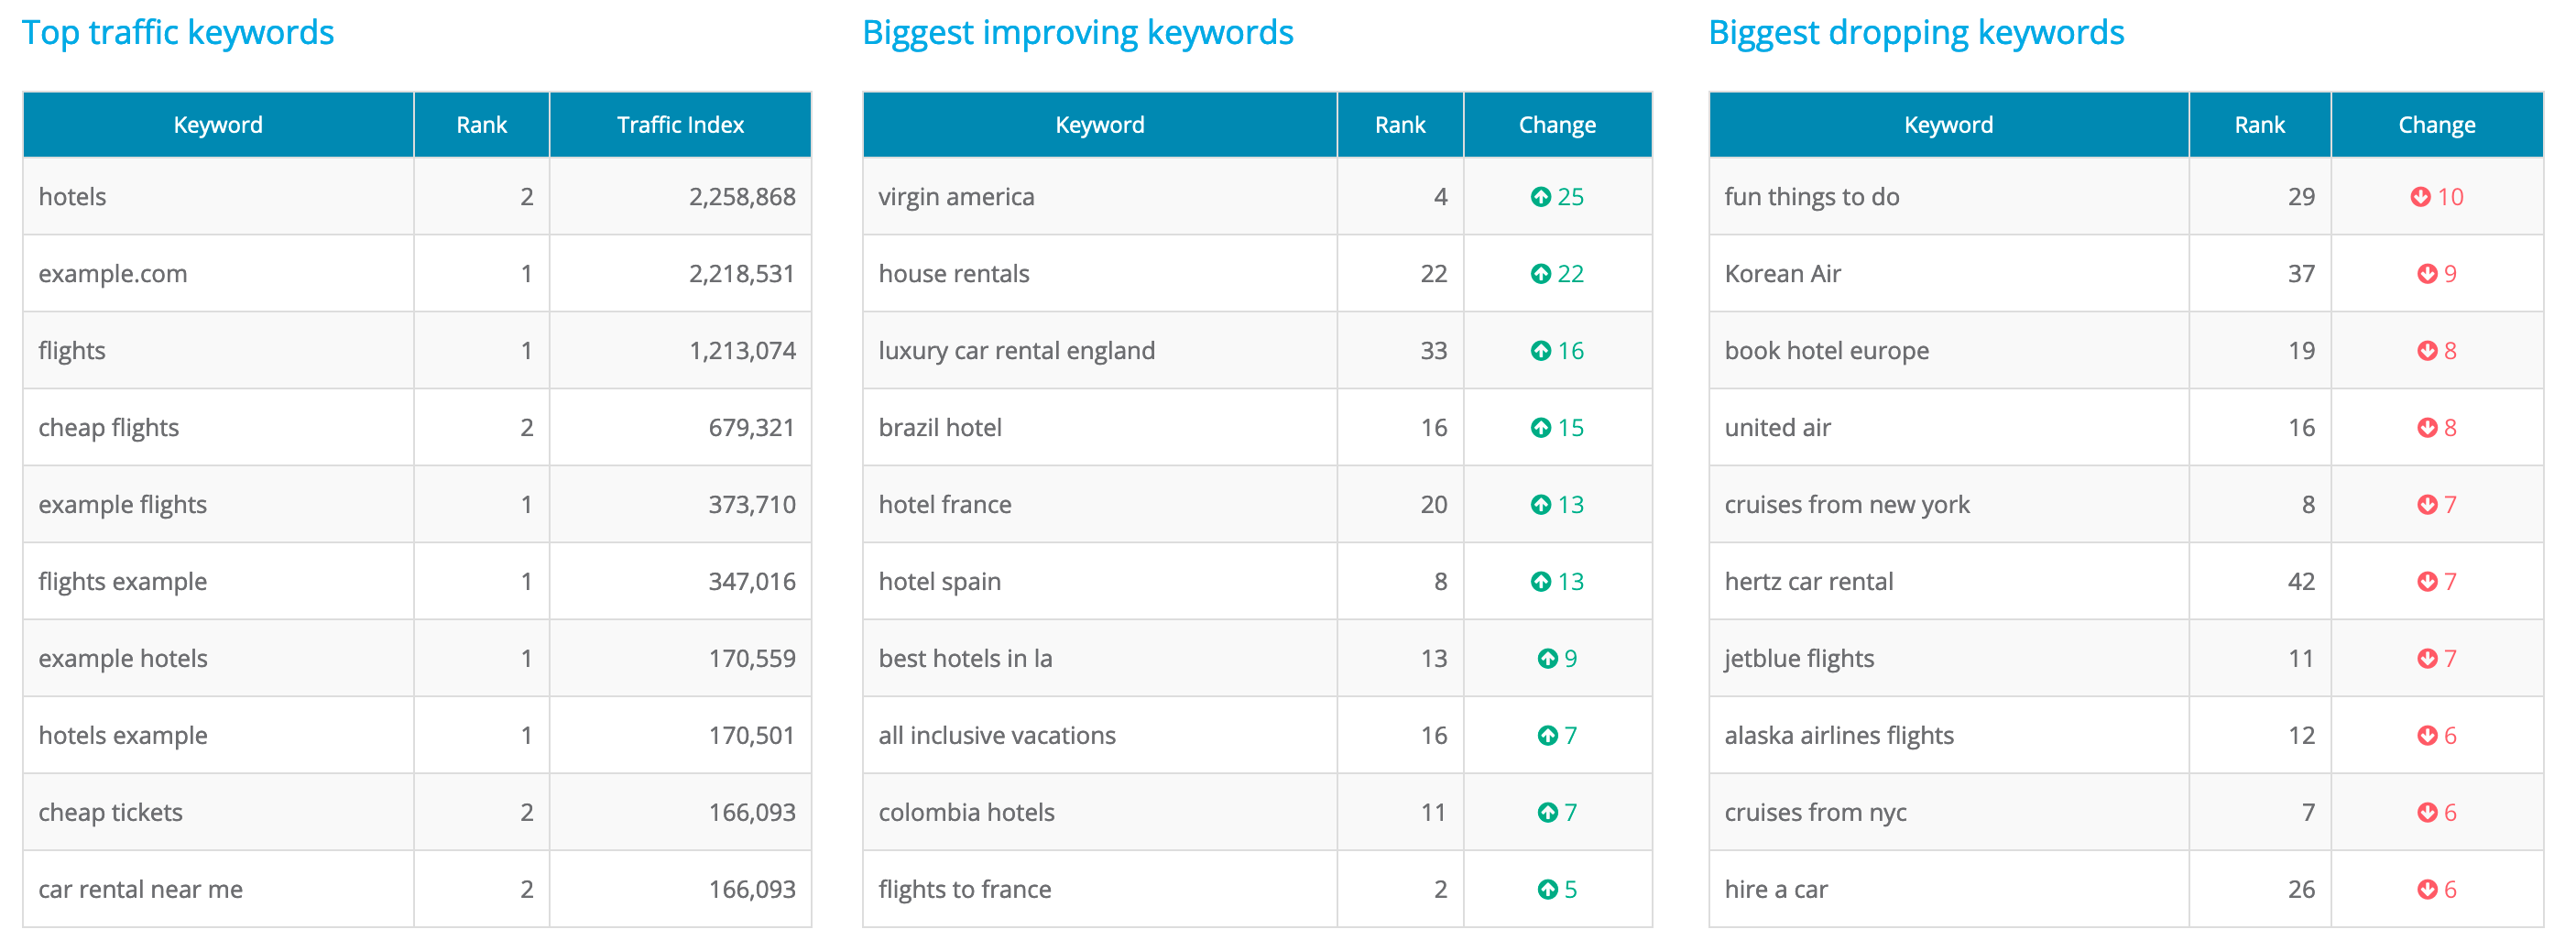
Clicking the title of each area will take you to the keyword ranking page showing you all keywords sorted by the appropriate field for each report (Traffic Index, positions change up, or positions change down).
Similar to the chart at the top of the page, we’ll show Google Search Console organic clicks and impressions as well as Google Analytics organic sessions and conversions. Clicking the title will take you to a more detailed report for each area.
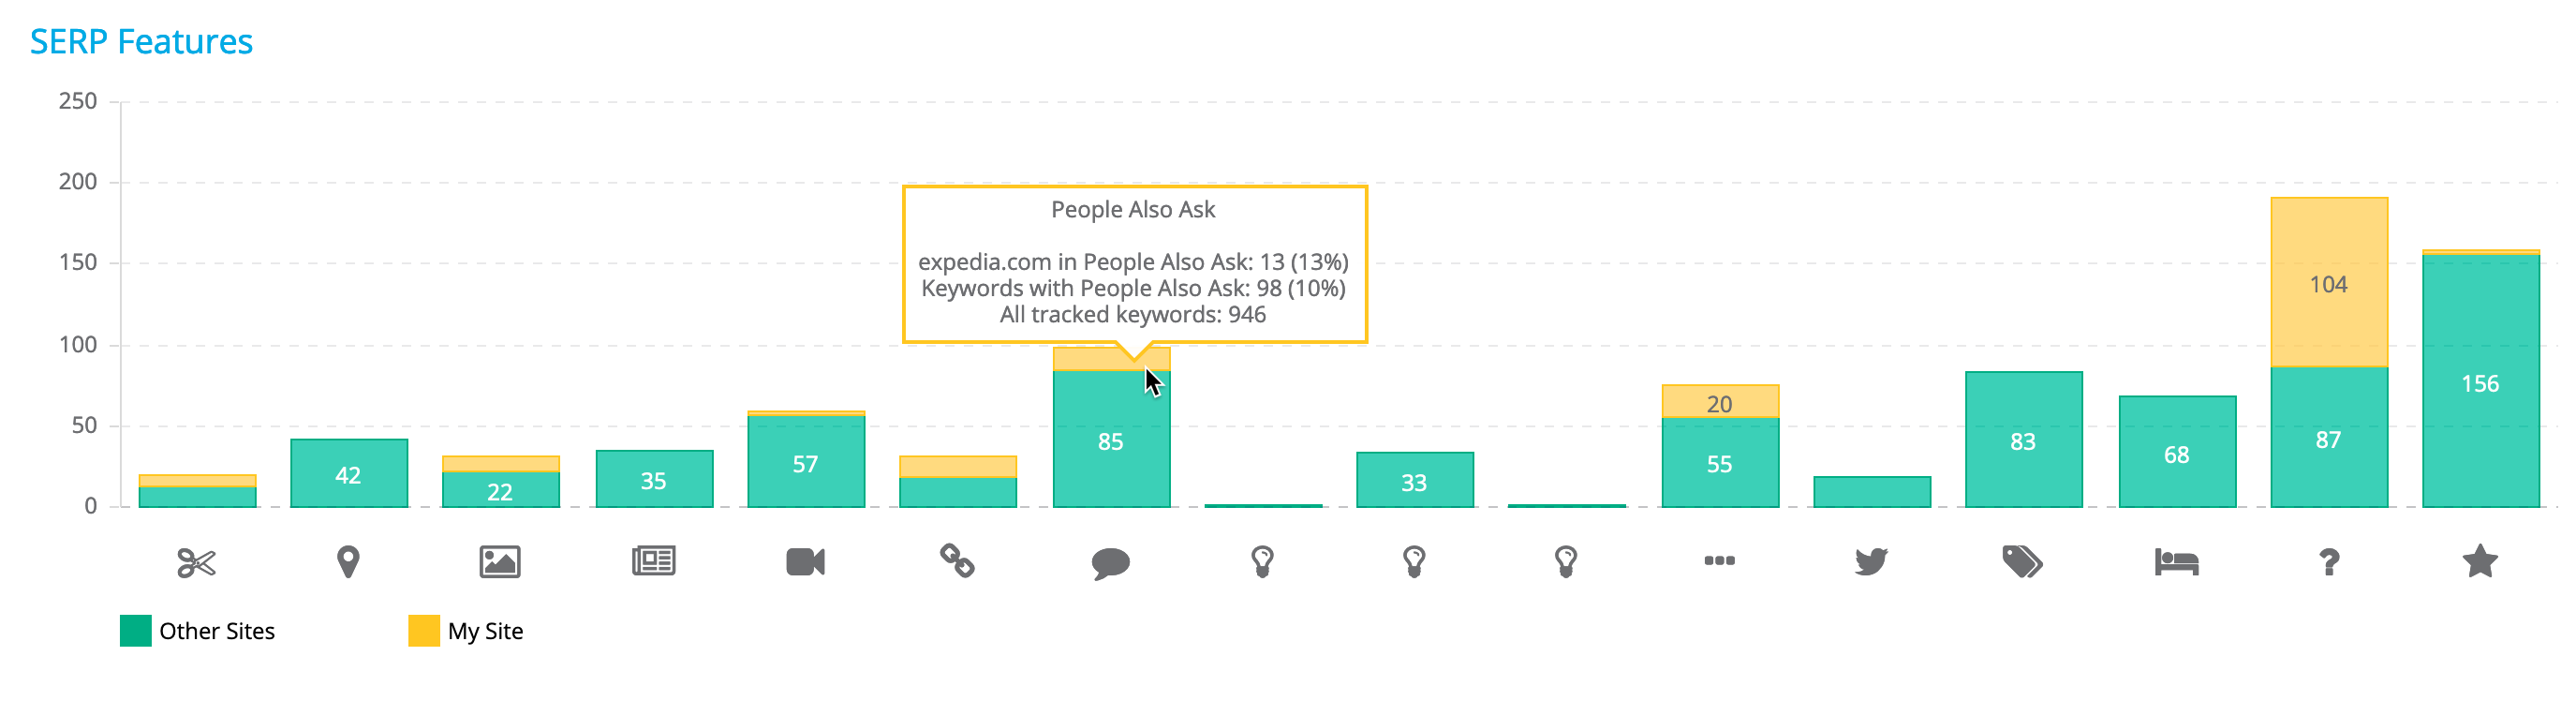
The SERP Features area shows you which rich result types are appearing for tracked keywords and the number of times your site is ranked in each.
Far more details are available on the SERP Features report by clicking the title above the section.
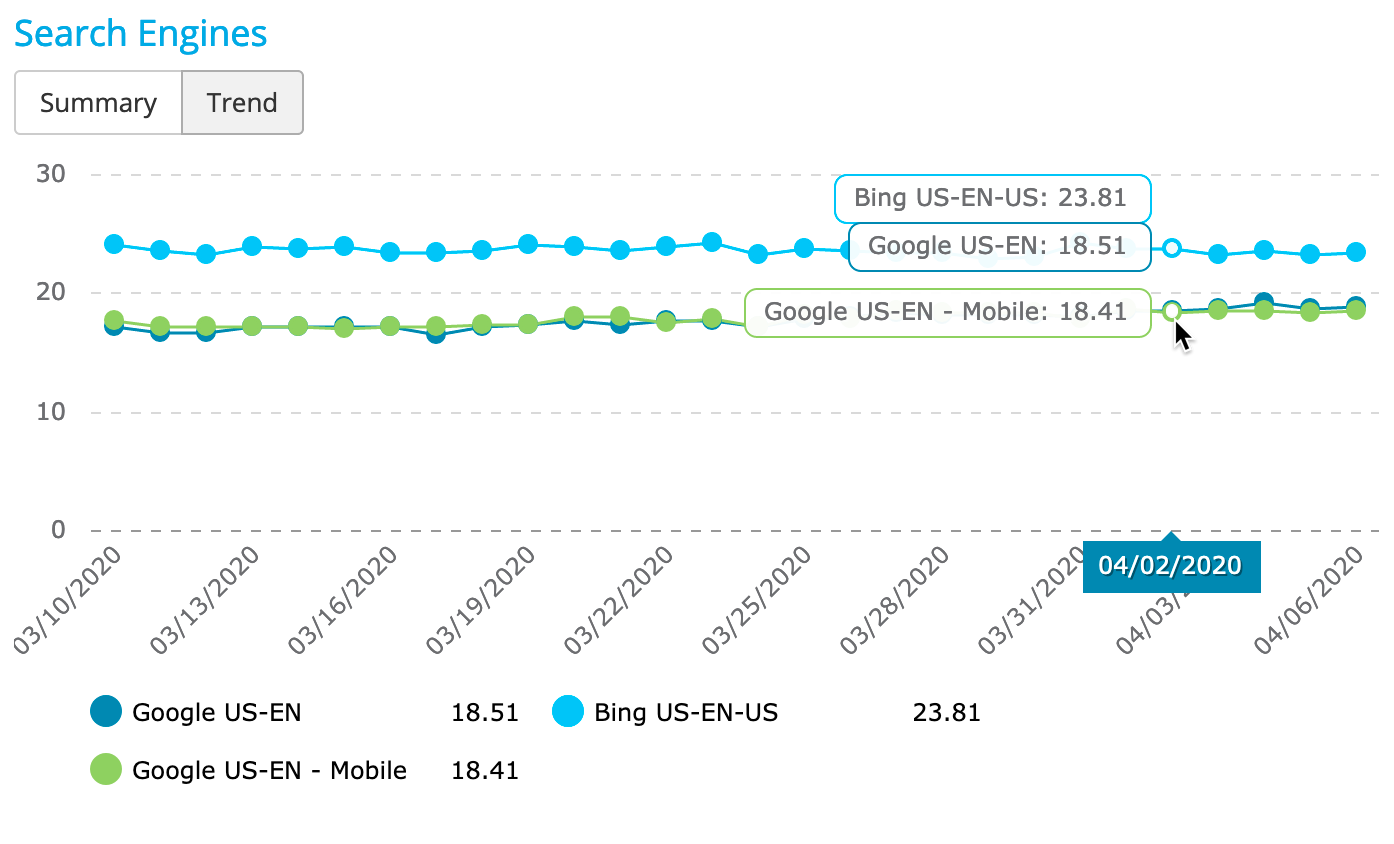
If this campaign is tracking multiple search engines, you can view a comparison of Organic Visibility for each one. Click the title to see more details on Search Engine Ranking.
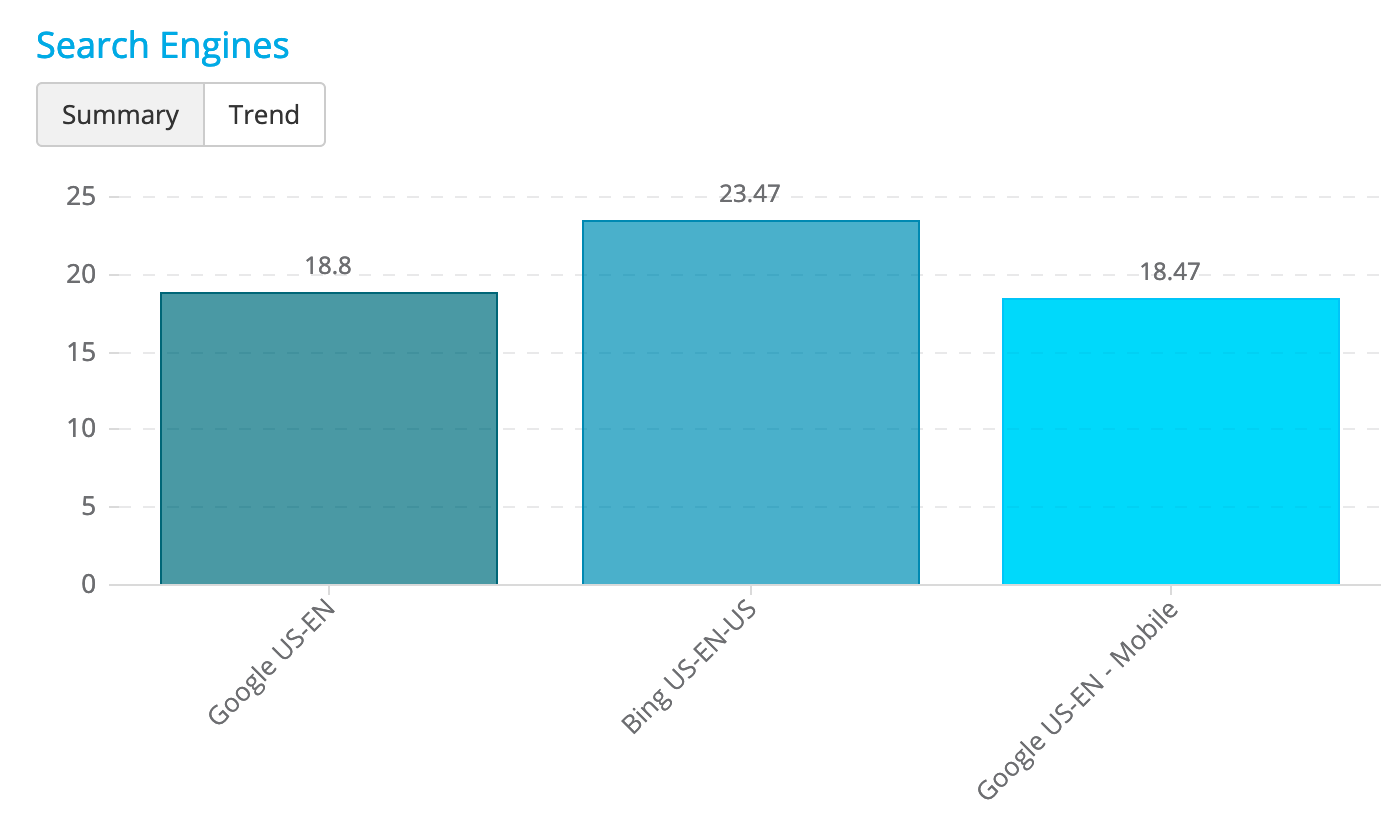
You can also click the Trend button to see a trended view during the selected date range.
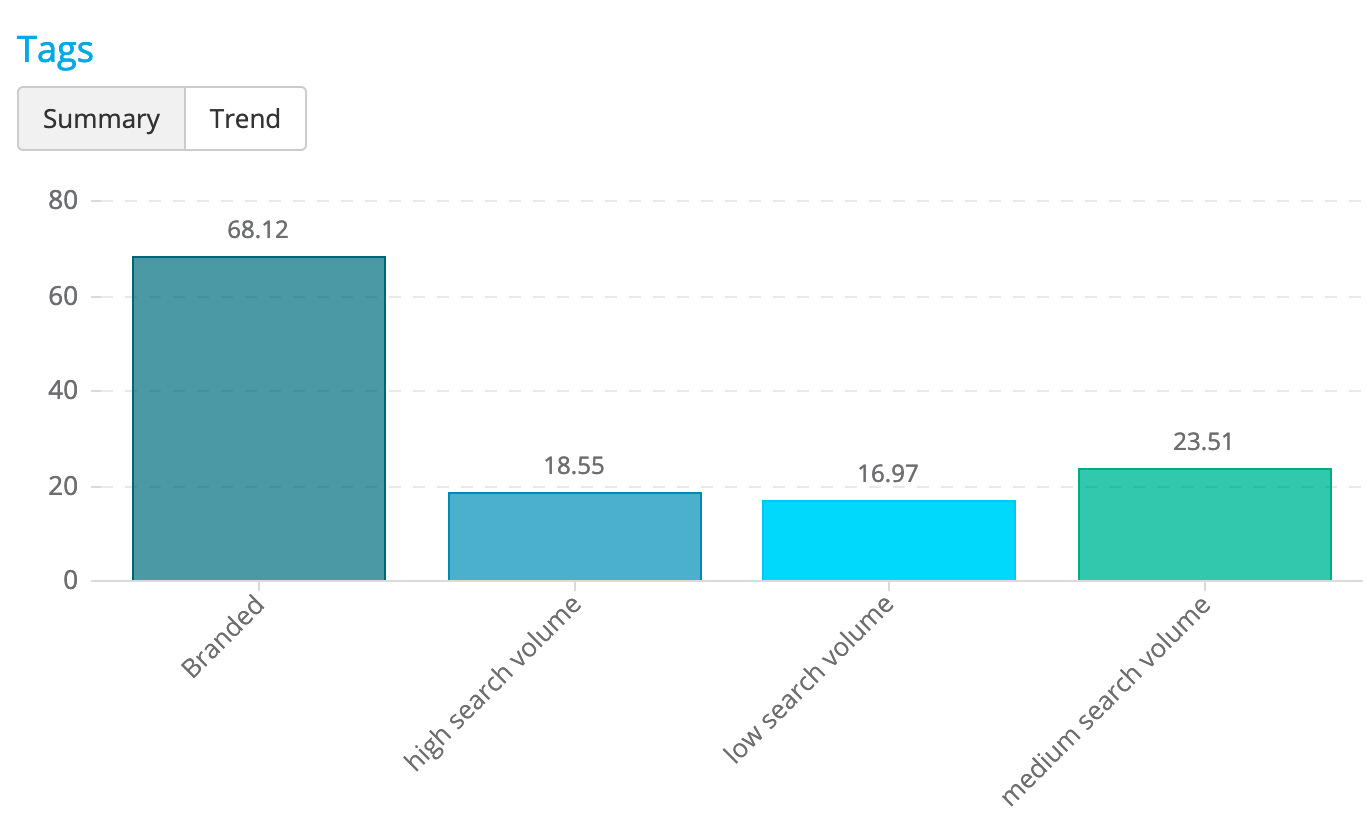
Similarly, you can see a performance comparison across tags as a summary or a trend. Click the title to see more details on Tag Ranking.
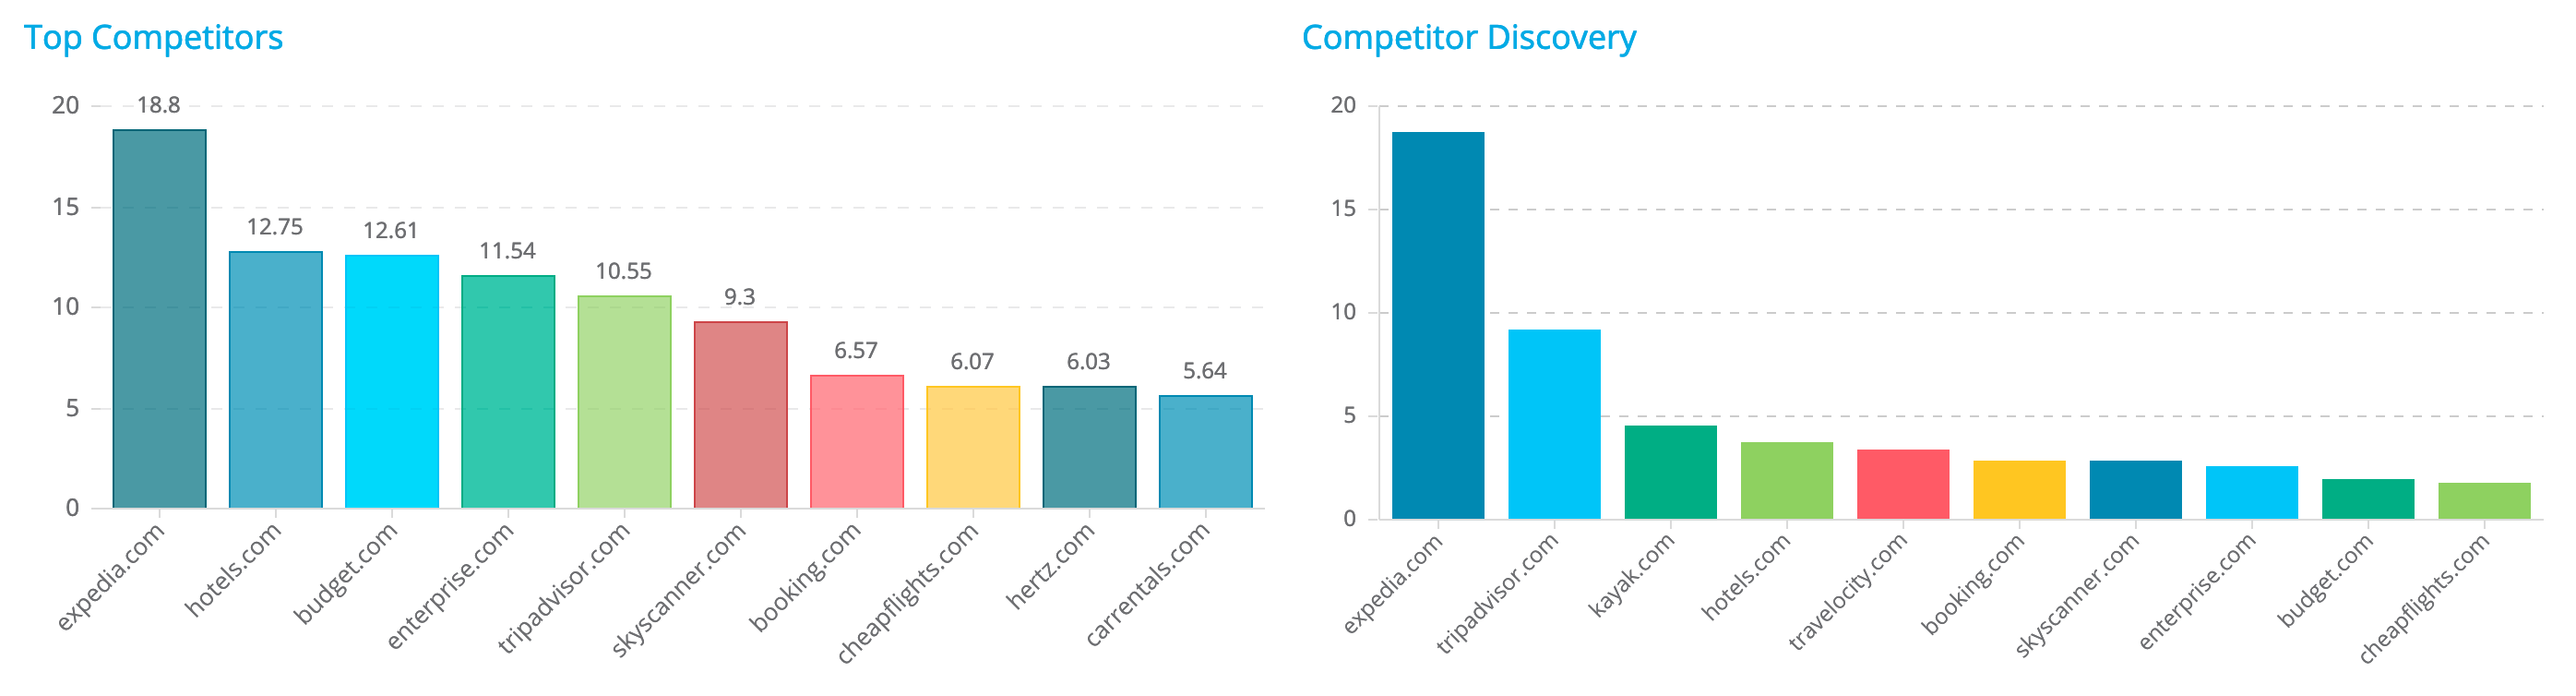
Two competitor reports are available next:
Detailed reports are available by clicking the title of each section.
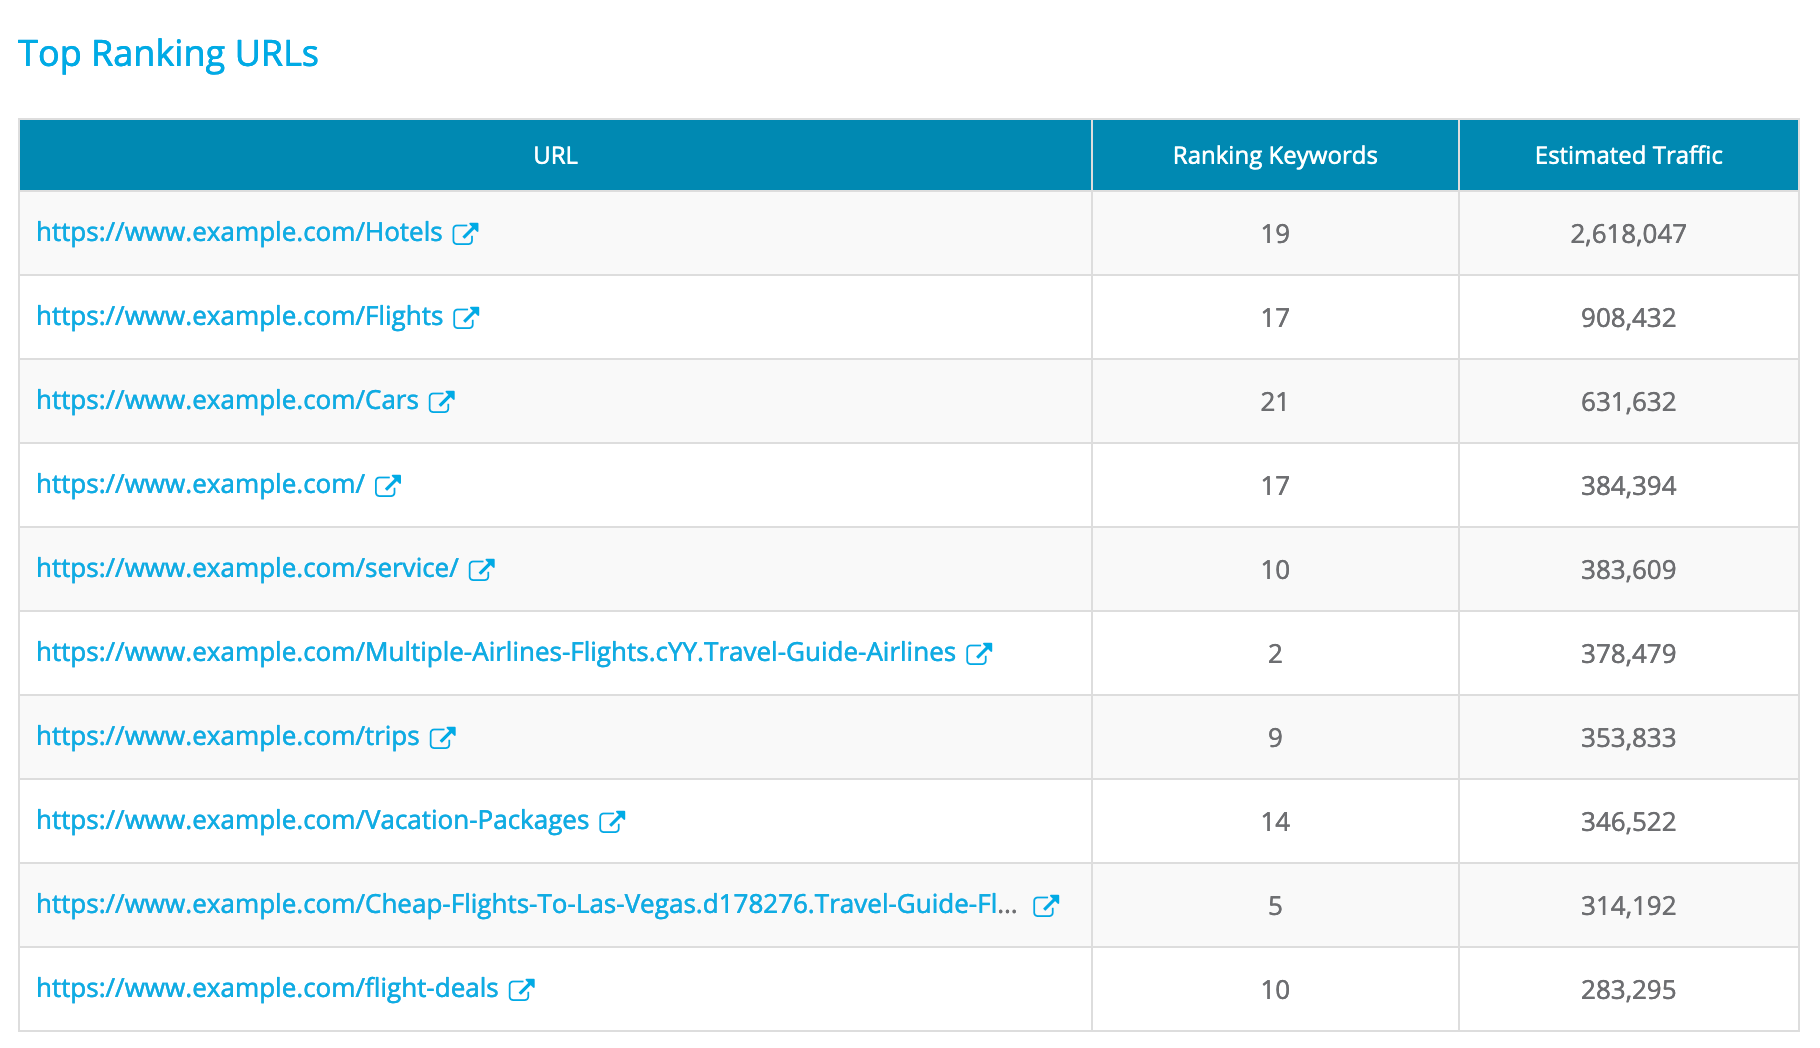
Finally, we’ll show the top 10 ranking URLs as sorted by the sum of Traffic Index for all keywords this URL ranks for. For a more detailed look, click the title to go to the Landing Page Ranking report.
All of these reports are loaded quickly on the Ranking Overview page, bringing out the highlights of each ranking view without having to click into each report. If you need more information, just click on the title header to dive down deeper. It’s the perfect place to start when taking a look at your site’s ranking data.
What do you think of Ranking Overview? We’d love to hear your feedback, just open the live chat and drop us a line!