Track historic search volumes over time with Search Demand Trends

How many people are searching for our targeted keywords? Is the demand for our products and services increasing or decreasing? Is our brand or trademarked terms becoming more popular? These are important questions that every marketing team asks. Now, with the new Search Demand Trends report in Dragon Metrics, you can get answers to these and many other questions quickly and easily.
While many organic search teams primarily focus on improving ranking position of their targeted keywords, it can be easy to forget that this is just one piece of the puzzle. Organic search traffic is determined by three main factors: Ranking position, click-through rate, and the number of people searching for the term.
Especially in the current turbulent environment where many industries have seen huge shifts in search demand, it’s incredibly important to understand this crucial component in organic traffic. If you see a major change in traffic to your site but ranking and CTR remain constant, a change in search demand is likely the cause.
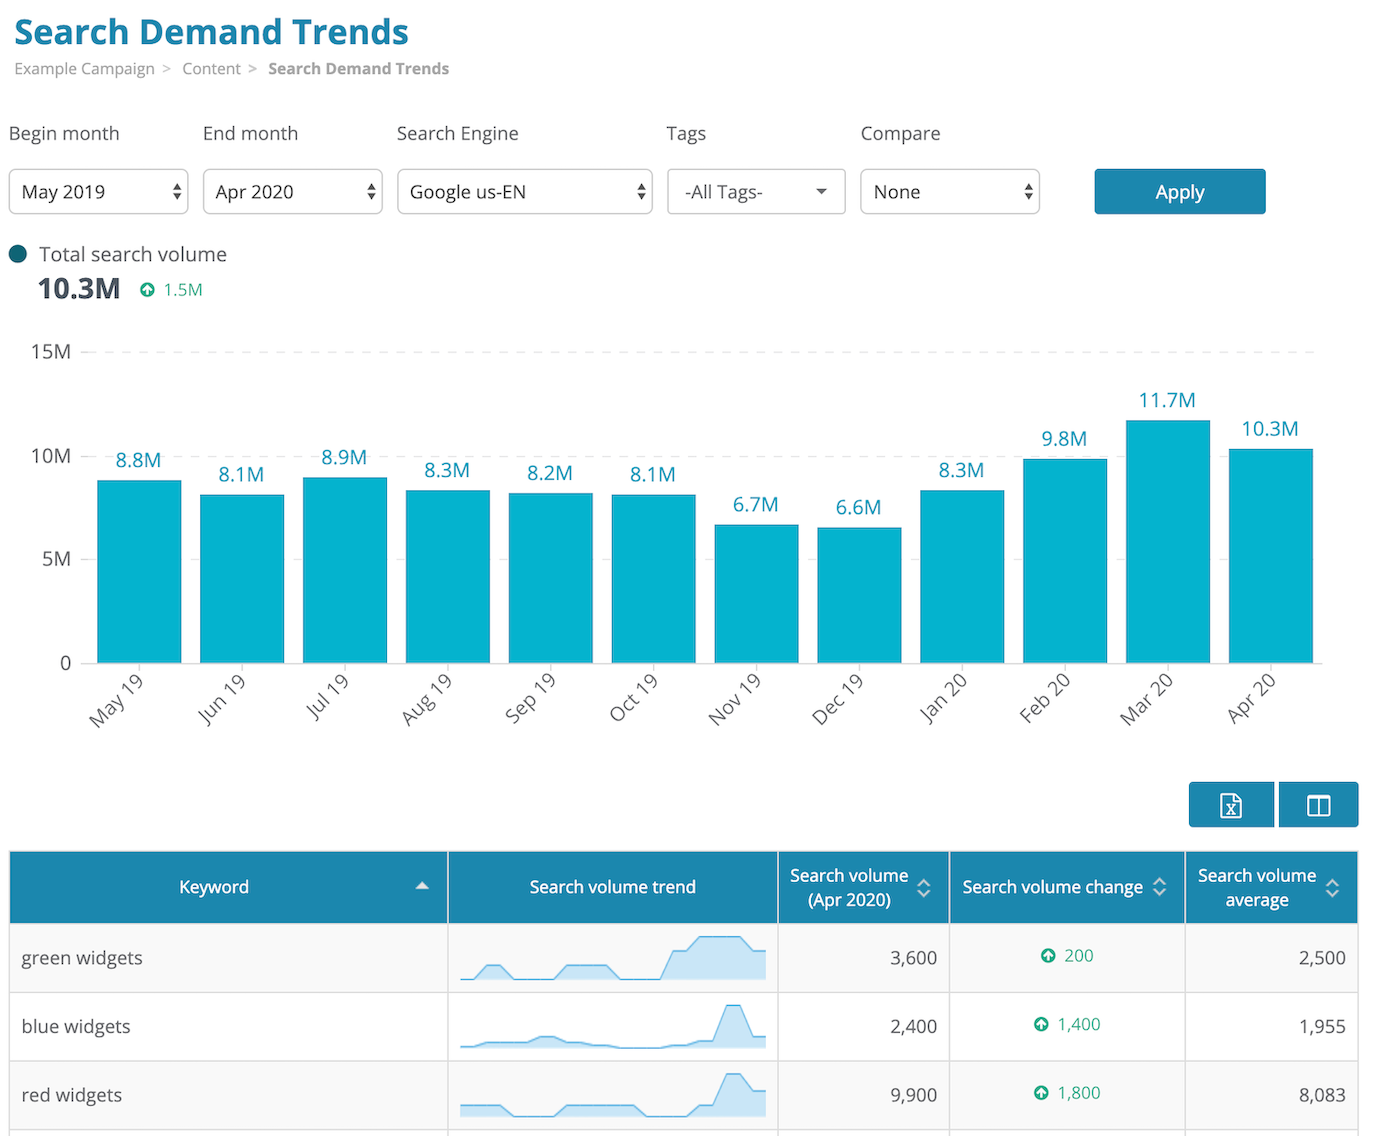
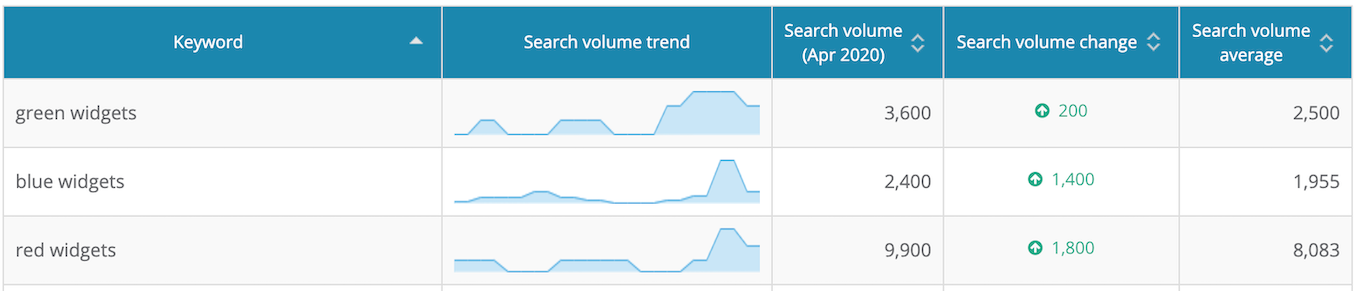
We’ve collected a historic trend of the search volume for each tracked keyword, which is available in the table towards the bottom of this report, showing a trend of the monthly search volume during the selected period, the search volume for the most recent month, a comparison to the first date in the range, and an average for the entire range.
At the top of the page, monthly search volumes are summed for all keywords, showing the aggregate demand for all tracked keywords.
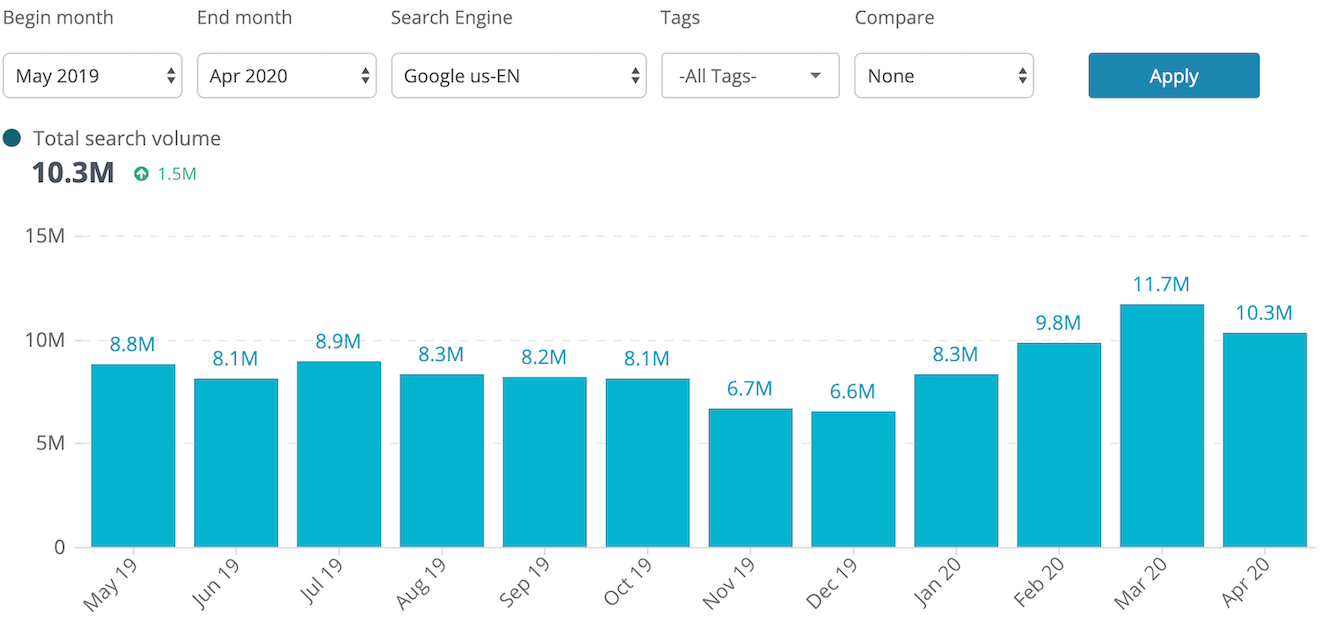
By default, search volume trends for all keywords are shown. To view trends for a set of tags, simply choose them from the filter at the top of the page.
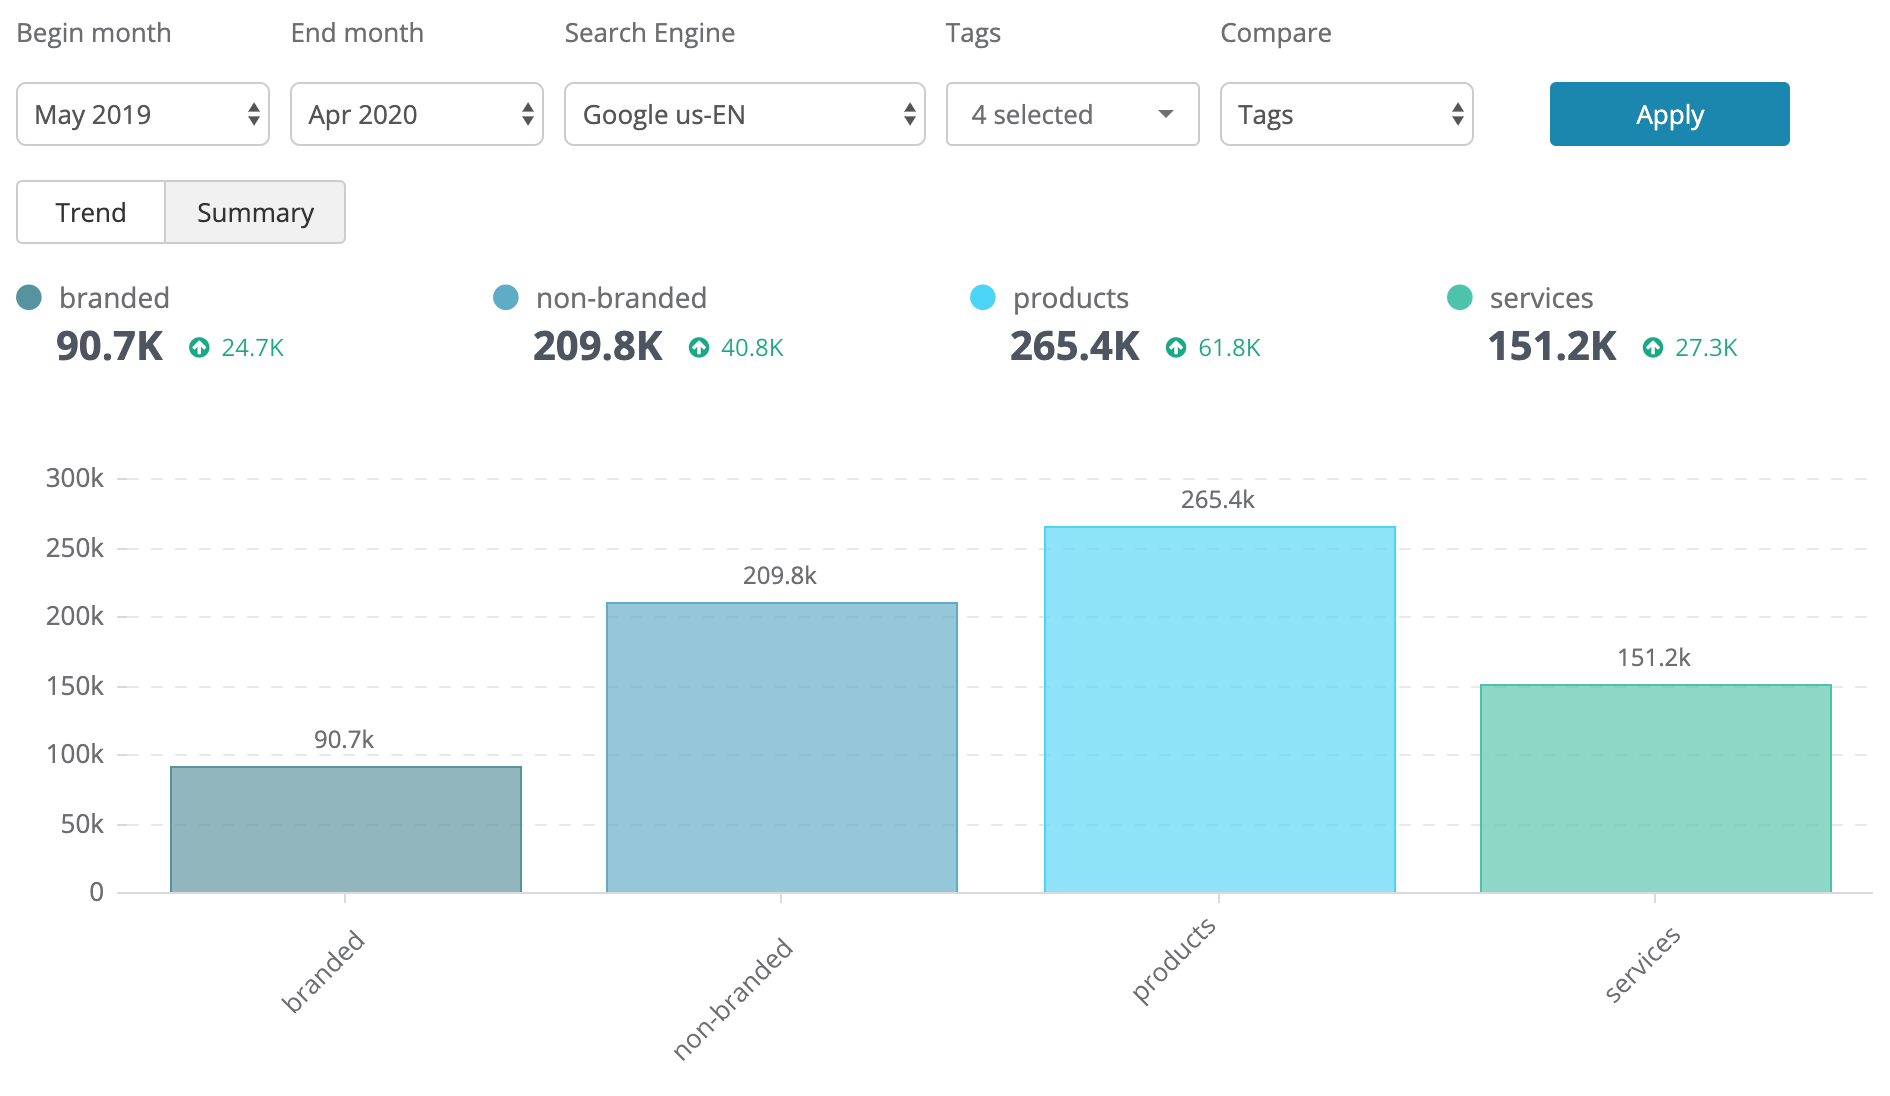
The real power of Search Demand Trends comes in when comparing performance by tag. When setting Compare to Tags in the top filter, the dimension of the top chart changes to Tags. Now you can compare trends of individual sets of keywords against each other.
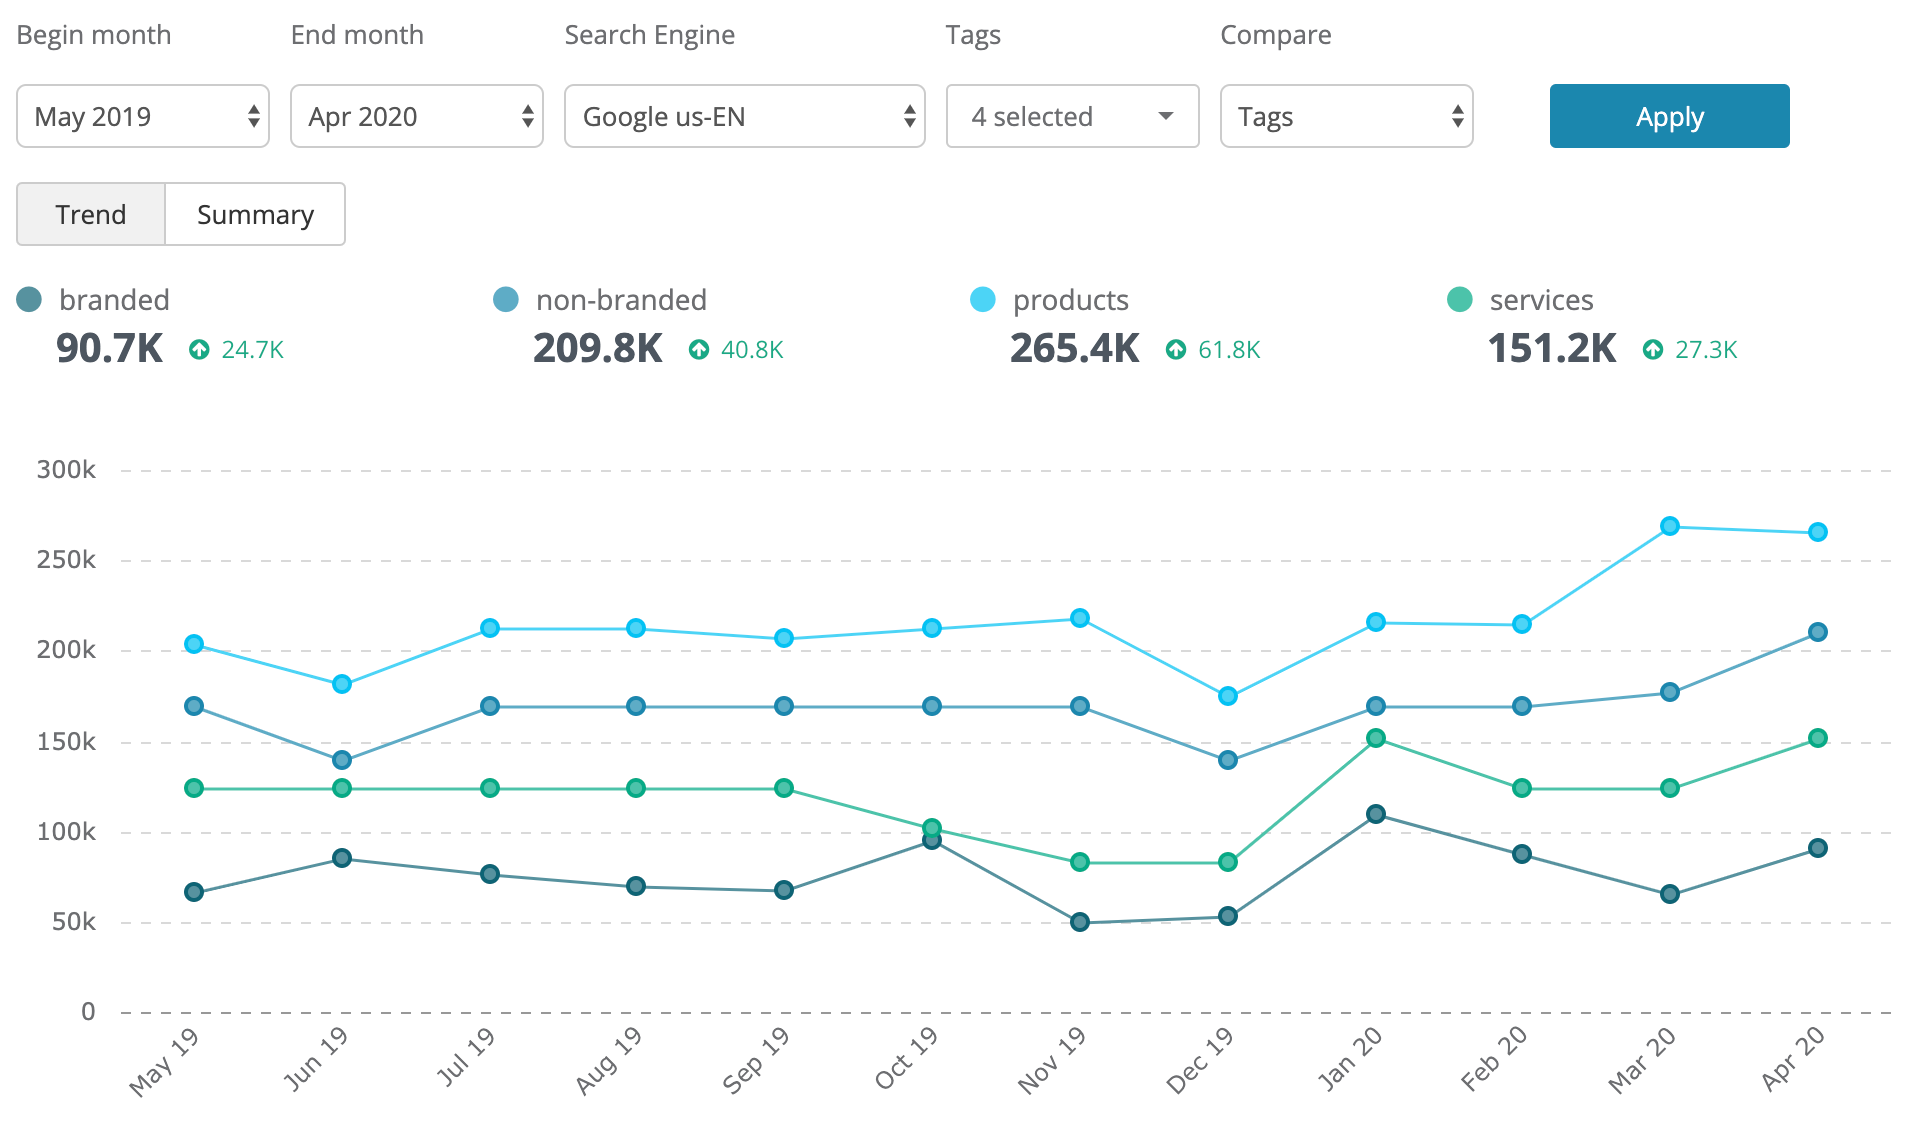
This is great for seeing how popular branded keywords are performing over time (e.g. is my brand getting more or less popular?) or seeing demand trends for individual product lines, trademarked terms, or any other segment you set up.
You can even see a summary comparison for the most recent month selected by setting the chart to Summary.
Let’s look at a couple of examples of how this data can be useful.
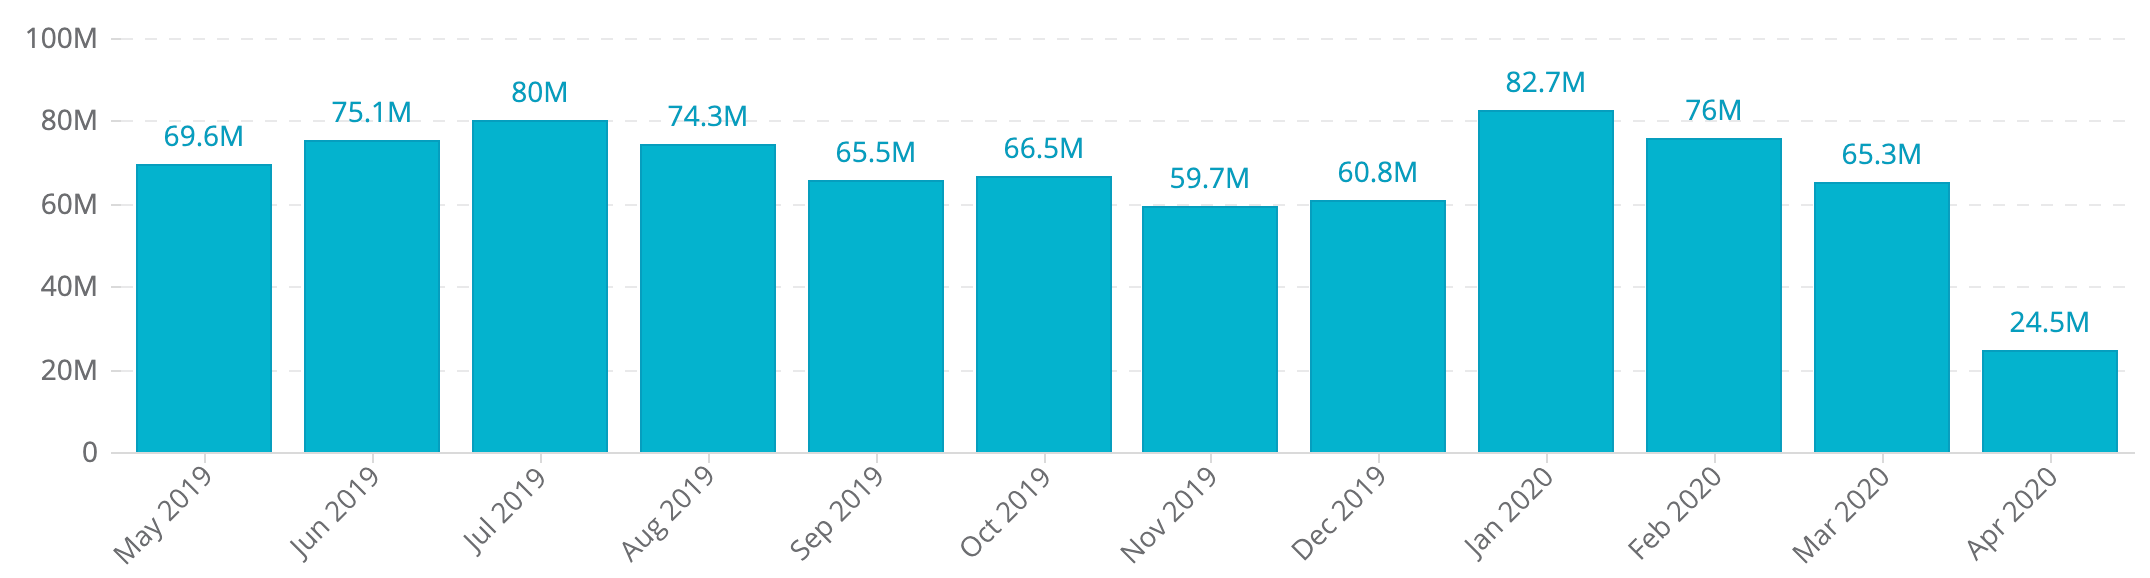
First up, we all know how COVID-19 has had a devastating effect on the travel industry. Pulling up search demand trends for a travel site’s US campaign, we can see a sizable decline in demand for travel-related keywords starting in March, with a massive drop in April.
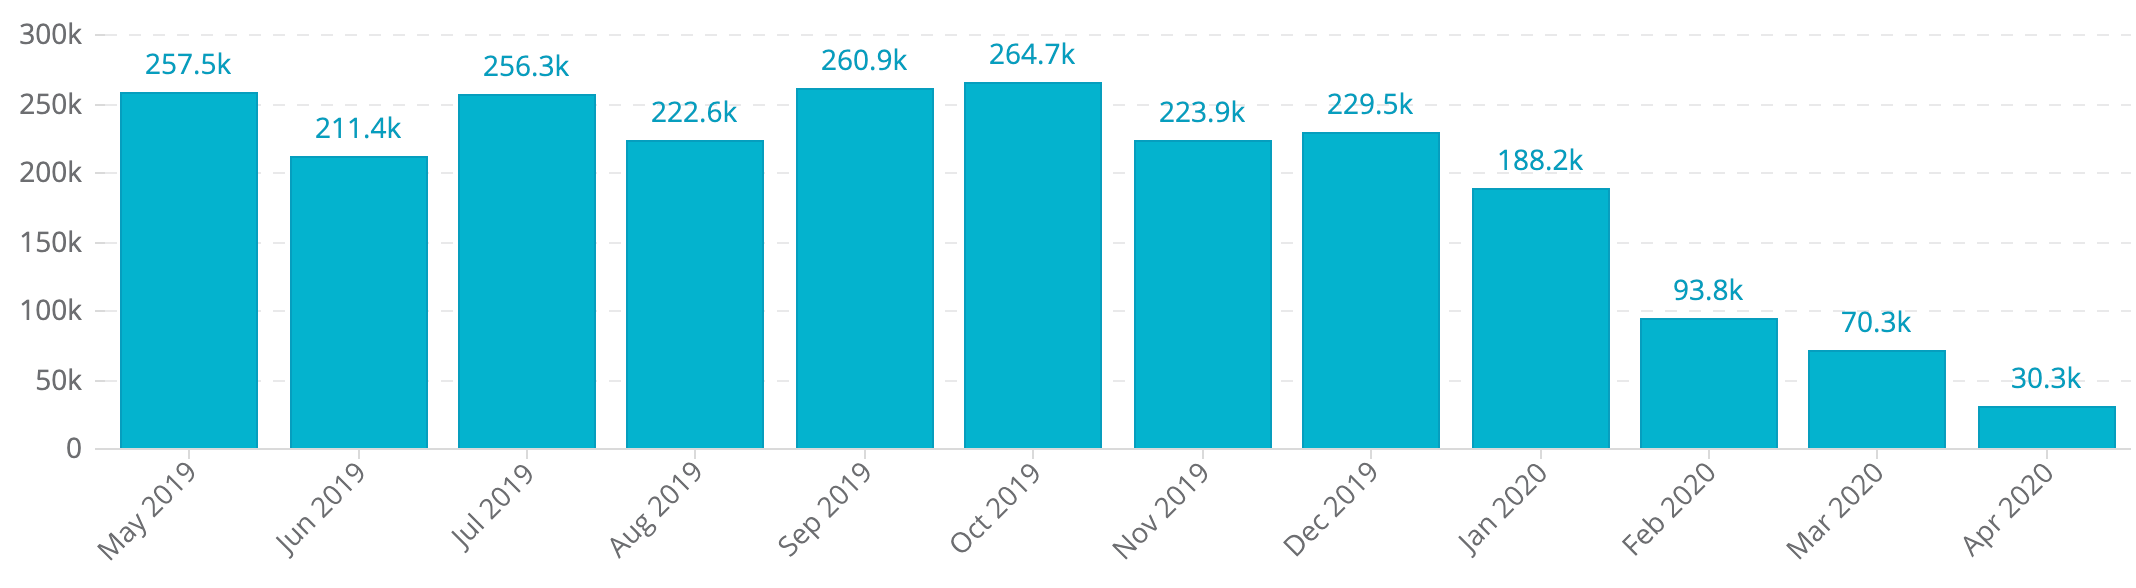
But now if we swap campaigns to look at a similar set of keywords in Hong Kong, we can see the decline started much earlier, with the biggest drop in February.
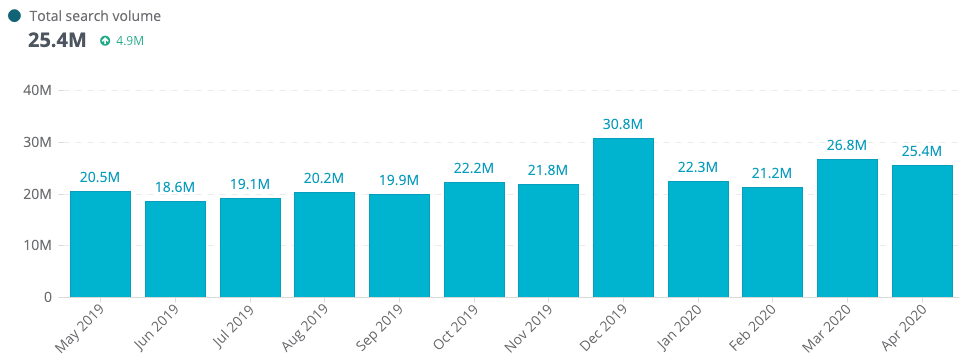
Let’s take a look at another example, this time a pharmacy chain in the US. When looking at all keywords in total, we can see a bit of spike in December, and then another small jump in March and April.
Pharmacies carry a wide range of products, so to better understand market demand, let’s split it out by tag. For simplicity, we’ll just look at 3 product lines: contact lenses, photo services, and pharmacy (medication) related keywords.
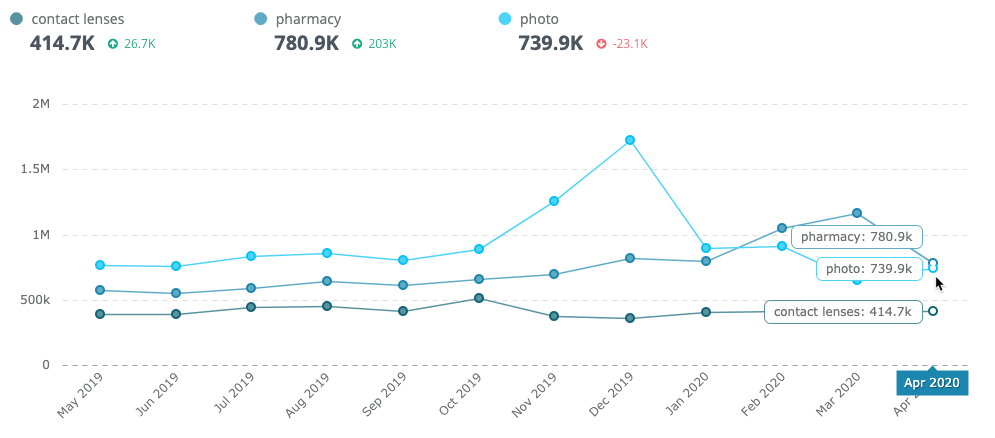
Now we can see the spike in demand during December was due much in part by photo-related keywords. (Perhaps families ordering prints of holiday photos?) But then starting in March, demand for photo-related keywords has plummeted. (Less to photograph when quarantined indoors?)
Pharmacy/medication keywords spiked in February in March (people stocking up on medication due to the pandemic?), and then leveled off in April. All the while, demand for contact lenses has remained relatively constant.
The new Search Demand Trends report is not all that’s new today. We’ve also updated Keyword Ranking to include a 12-month trend of monthly search volumes too. Now you can view trends for both MSV and ranking position together.
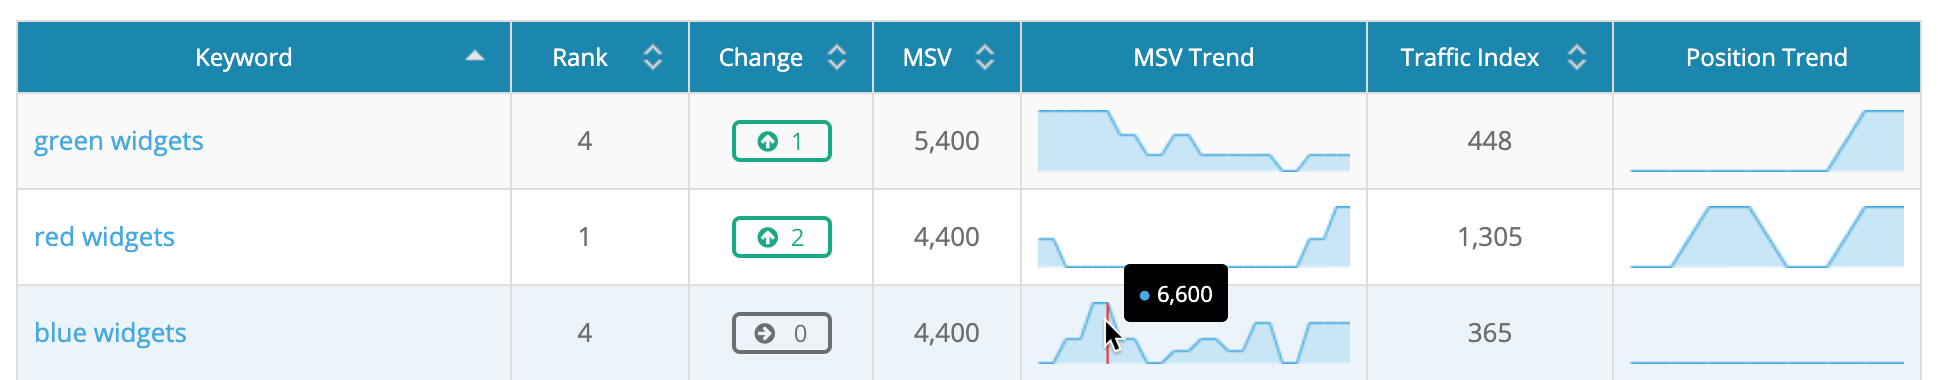
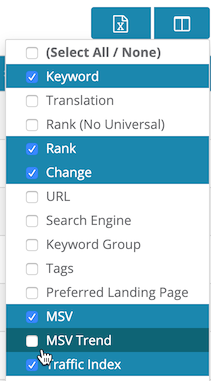
The new MSV Trend column is hidden by default. To show in the table, select it under the View options button at the upper right of the table. MSV Trend is also available in Excel exports.
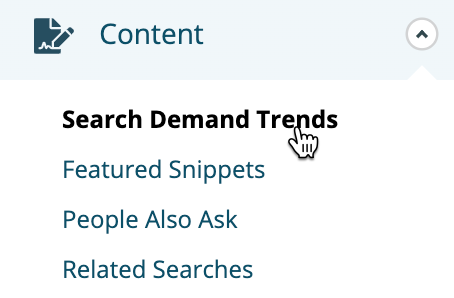
Search Demand Trends can be found under the Content section in the left navigation.
You may notice one other change in today’s launch — we’ve also simplified the left navigation, removing the Competitors section. Reports previously found here have been moved to the Ranking section.
Search Demand Trends are available right at all subscription levels for Google, Bing, Baidu, and Naver.
Please note that at launch, a 12-month trend is available for Google and 6 months for Bing. Because search volume data is only available for the most recent 30 days for both Baidu and Naver, today you will only see 1 month of data for keywords tracking on these search engines. After 1 month, two months will be available, after 2 months three will be available, and so on. The longer you track you keywords on Baidu and Naver, the longer the search volume history you’ll have.
Give Search Demand Trends a try and as always, let us know what you think using the live chat in the bottom right of every page!